Safety Stock Formula: 3 Ways to Calculate It, With a Worked Example
Three safety stock formulas on one product: worst case, demand variability and combined. Includes a Z table, the working and a free Excel calculator.
On this page
- What is safety stock?
- The example: 28 days of sales and six lead times
- Method 1: the worst case
- Z scores and service levels in plain language
- Method 2: demand variability only
- Method 3: demand and lead time variability together
- The three methods side by side, and which to use
- When the formulas break
- Choosing a service level: the cost side
- How to review your safety stock
- Where Channel Bay fits
Key Takeaways
- Safety stock covers the gap between an average week and a bad one: sales above average and a delivery later than average. Reorder point = lead time demand + safety stock.
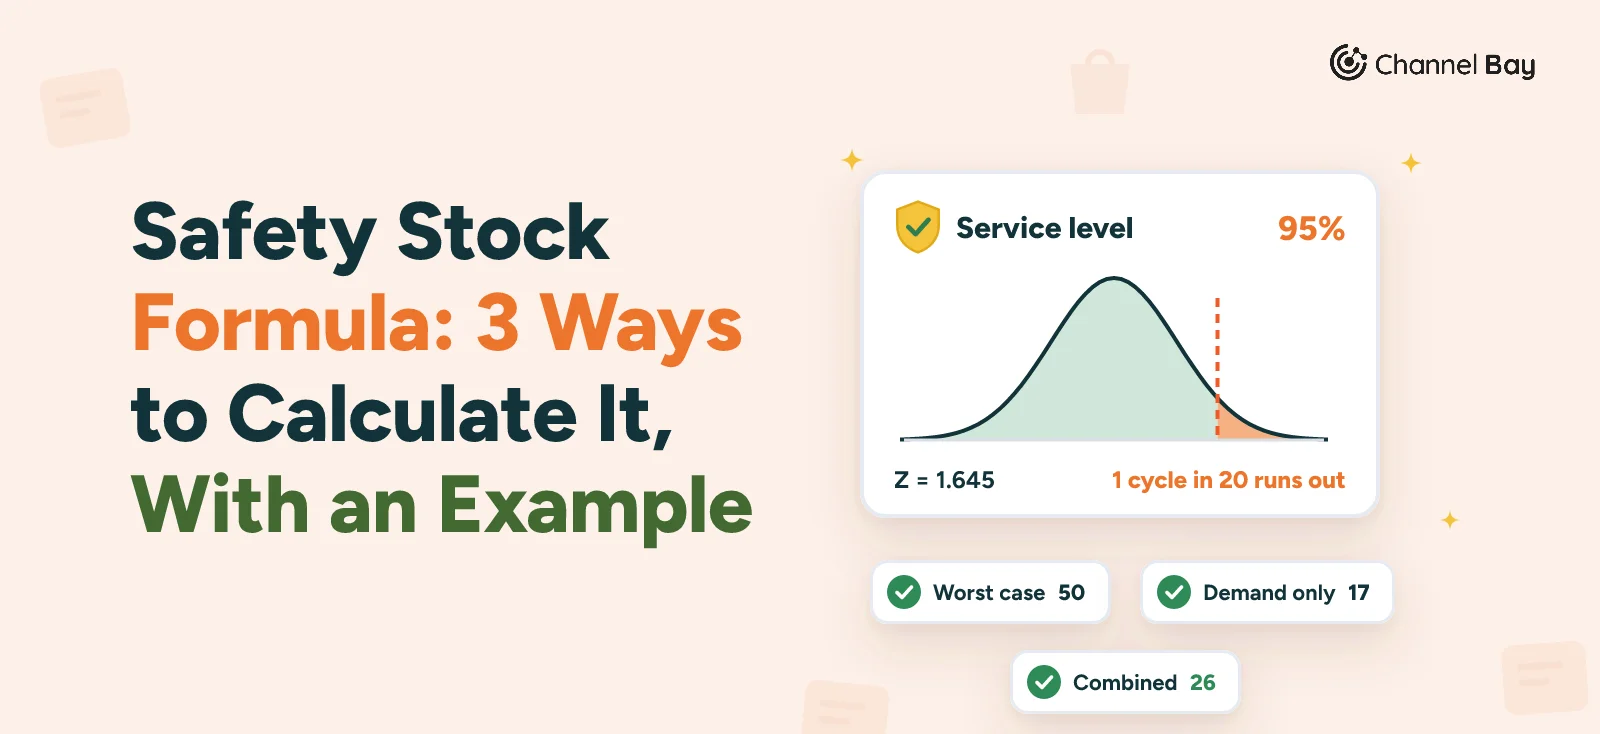
- On one mug the three formulas give 50 (worst case), 17 (demand variability only) and 26 (demand and lead time together, at a 95% service level). Which one fits depends on how much history you have and how reliable the supplier is.
- A 95% service level means about one replenishment cycle in twenty runs out of stock. Z is 1.645 for 95% and 2.326 for 99%, and each step up costs more units.
- For the mug, the supplier's spread in delivery time (11.9 mugs) matters more than the spread in sales (10.0). The demand-only formula promised 95% and delivered about 88% when we resampled the same data.
- The statistical formulas assume steady, independent, roughly normal demand. For slow movers, lumpy B2B orders, seasonal items and new products, use a whole-unit table, a recent window or a judgement call, then review after the first deliveries.
Safety stock is the extra stock you hold so a busy stretch or a late delivery doesn't leave you with nothing to sell. There are three common ways to size it, and they give different answers for the same product. On the example in this guide, a white 12 oz mug, they give 50, 17 and 26 mugs.
- Worst case: (highest daily sales x longest lead time) − (average daily sales x average lead time)
- Demand variability only: Z x standard deviation of daily sales x √lead time
- Combined: Z x √(lead time x variance of daily sales + average daily sales² x variance of lead time)
Z is a number that comes from the service level you choose, and we explain it below. If you're new to purchase orders, start with our guide to what a purchase order is and how it works. This guide goes deeper on one number inside the reorder point: how big the buffer should be.
You can follow every number in our free safety stock calculator. It comes as an Excel file (.xlsx) and as a Google Sheets version, which asks you to make a copy in your own Google Drive. It has the three methods, the Z table and this example filled in, and there is no sign-up.
What Is Safety Stock?
Safety stock is a buffer above the stock you expect to need while you wait for a delivery. Buffer stock is often used to mean the same thing, though some writers reserve safety stock for a buffer sized with statistics. A reorder point has two parts:
Reorder point = lead time demand + safety stock
Lead time demand is what you expect to sell between placing a purchase order and being able to sell the stock. Safety stock is the cushion on top. Our reorder point guide covers the whole formula and the other inputs. This one is about sizing the cushion.
One formula you'll see in forum answers is "safety stock = daily sales x lead days". That is the lead time demand, not the buffer. A mug that sells 4 a day with a 25-day wait has a lead time demand of 100. Reordering at 100 with no safety stock means the delivery lands as the last mug sells, and any bad day or late truck means a stockout.
The Example: 28 Days of Sales and Six Lead Times
The example is the one used across our purchase order guides: a kitchenware brand selling white 12 oz mugs, SKU MUG-WHT-12. Here are its last 28 days of sales, in four weeks of seven days:
| Week | Day 1 | Day 2 | Day 3 | Day 4 | Day 5 | Day 6 | Day 7 | Total |
|---|---|---|---|---|---|---|---|---|
| 1 | 4 | 4 | 5 | 1 | 5 | 4 | 5 | 28 |
| 2 | 6 | 2 | 3 | 4 | 1 | 8 | 2 | 26 |
| 3 | 3 | 1 | 4 | 6 | 1 | 7 | 1 | 23 |
| 4 | 4 | 4 | 4 | 7 | 6 | 6 | 4 | 35 |
- Average daily sales: 112 mugs / 28 days = 4.0 a day.
- Busiest week: week 4, 35 / 7 = 5.0 a day. This is the "busiest stretch" in the reorder point guide.
The last six purchase orders for the mug took this many days from sending the PO to having the mugs on the shelf, oldest first: 30, 21, 24, 24, 25, 26. The last three are the 24, 25 and 26 used in the reorder point guide.
- Average lead time: 150 / 6 = 25 days.
- Longest lead time: 30 days.
Standard Deviation, Step by Step
The standard deviation says how far a typical day sits from the average. To work it out for daily sales:
- Take each day's sales away from the average of 4.0, and square the result. A day with 8 sales gives (8 − 4)² = 16.
- Add all 28 squares. They sum to 108.
- Divide by 27, which is 28 days minus 1. That gives a variance of 108 / 27 = 4.0.
- Take the square root: √4.0 = 2.0.
Dividing by 27 instead of 28 gives the sample standard deviation, which is the one we use. It is the right choice when the days you measured stand in for all the days that could have happened. Dividing by 28 gives the population version, √(108 / 28) = 1.96. In Excel and Google Sheets, STDEV.S is the sample version and STDEV.P the population one. With 28 days they differ by about 2%.
Lead times work the same way. Each lead time minus 25, squared: 25, 16, 1, 1, 0 and 1. They add to 44. Divided by 5 (six orders minus 1), the variance is 8.8 and the standard deviation is √8.8 = 2.97 days. Six purchase orders is a small sample, so treat that number as rough.
Method 1: the Worst Case
The simplest method needs no statistics. Compare a bad case with the average case:
Safety stock = (highest daily sales x longest lead time) − (average daily sales x average lead time)
This is the version in our reorder point guide, with the busiest week's rate of 5 a day and the slowest delivery of 30 days:
(5 x 30) − (4 x 25) = 150 − 100 = 50 mugs
Reorder point = 100 + 50 = 150.
Be clear about what "highest daily sales" means, because it moves the answer a lot. The mug's single busiest day was 8 sales. Using that instead of the busiest week gives (8 x 30) − 100 = 140 mugs, nearly three times as much, for a day that happened once.
- What it assumes: nothing about how sales are spread. It assumes the worst sales and the worst delivery arrive together, which is rare.
- Where it breaks: one promotion day or one unusually late delivery sets the number, and a longer history can only push it up. It has no service level, so you can't tell how safe it is. We measured it on this mug below.
- When to use it: a new product with no history, or an item where running out is very costly and the extra stock is cheap.
Z Scores and Service Levels in Plain Language
The two statistical methods ask a different question: how often are you willing to run out? That answer is the service level. At 95%, you accept that about one replenishment cycle in twenty will run out of stock before the delivery lands. A replenishment cycle runs from placing the order until the delivery arrives.
This is the cycle service level. It is not the fill rate, which is the share of units customers asked for that you could supply. The two can look very different. At 95%, the mug is short by 0.32 units per cycle on average (see the cost table below), out of about 100 demanded during a wait, so it still fills about 99.7% of the units demanded in that wait, because a stockout late in a wait only misses a few sales.
Z turns a service level into a number of standard deviations. You stock Z standard deviations above the average demand during the wait. A bigger Z means a bigger buffer. These are computed from the normal distribution, not looked up from memory:
| Service level | Chance of a stockout per cycle | Z |
|---|---|---|
| 90% | 1 in 10 | 1.2816 |
| 95% | 1 in 20 | 1.6449 |
| 97.5% | 1 in 40 | 1.9600 |
| 99% | 1 in 100 | 2.3263 |
| 99.9% | 1 in 1,000 | 3.0902 |
In Excel or Google Sheets, =NORM.S.INV(0.95) returns the 95% value. The rest of this guide uses 95%, so Z = 1.6449.
Method 2: Demand Variability Only
If your supplier always delivers in the same number of days, the only uncertainty is sales. Then:
Safety stock = Z x standard deviation of daily sales x √lead time
For the mug at 95%: 1.6449 x 2.0 x √25 = 1.6449 x 2.0 x 5 = 16.45, which rounds up to 17 mugs.
Reorder point = 100 + 17 = 117.
The square root of the lead time is there because good days and bad days partly cancel out over a long wait. Over 25 days, sales vary by about 2.0 x 5 = 10 mugs either side of the average of 100, not by 2.0 x 25 = 50.
- What it assumes: the lead time is fixed, each day's sales are independent of the others, and total sales over the wait follow roughly a bell curve.
- Where it breaks: the lead time varies (the next method), sales trend up or down, sales come in a few large orders, or the item is seasonal.
- When to use it: a supplier who delivers to a schedule, or products you make yourself.
Method 3: Demand and Lead Time Variability Together
Many sellers don't have a fixed lead time. The combined formula adds the supplier's spread:
Safety stock = Z x √(lead time x variance of daily sales + average daily sales² x variance of lead time)
For the mug, the working goes in two parts. The sales part is 25 x 4.0 = 100. The lead time part is 4² x 8.8 = 16 x 8.8 = 140.8. Added together, 240.8, and the square root of that is 15.52:
1.6449 x 15.52 = 25.52, which rounds up to 26 mugs
Reorder point = 100 + 26 = 126.
The lead time part is bigger than the sales part. In mugs, sales vary by 10.0 over the wait (2.0 x 5), and the supplier's delivery time varies by 11.9 (4 x 2.97, since a day's slip costs about 4 mugs). For this mug, the supplier needs more buffer than the customers do. A demand-only formula misses that.
- What it assumes: sales and lead time are independent of each other, lead times are independent from one order to the next, and total sales over the wait are roughly normal.
- Where it breaks: if the delays and your busy periods come from the same cause, such as a supplier that is slow exactly when you are busy, the formula understates the buffer. It also leans on a lead time spread measured from only a few orders.
- Where to get lead times: from your own purchase orders, the day you sent the PO to the day the stock was received. The free purchase order tracker has a Date sent column, and our goods receipt guide covers receiving the delivery against the PO. Use the date you can sell the stock, not the supplier's quoted lead time.
The Three Methods Side by Side, and Which to Use
| Safety stock | Reorder point | Service level when resampled | |
|---|---|---|---|
| 1. Worst case | 50 | 150 | 99.97% |
| 2. Demand variability only, 95% | 17 | 117 | 87.7% |
| 3. Combined, 95% | 26 | 126 | 95.2% |
| No safety stock | 0 | 100 | 54.2% |
The last column is our own check. We drew a lead time at random from the six, then drew that many days of sales at random from the 28, and repeated it 100,000 times for each row. Then we counted how often the sales during the wait stayed within the reorder point. It checks that the formulas behave as intended on a product like this one. It does not say how any real store will perform.
Three things stand out:
- Method 2 promised 95% and delivered about 88%, because it ignored the supplier's spread. Method 3, which includes it, hit 95.2%.
- The worst case of 50 bought about 99.97%. That is a lot of stock for a mug that sells 4 a day.
- With no safety stock, the mug ran short in about 46% of cycles. Reordering at lead time demand alone is close to a coin flip.
Which to use:
- No history, or a new product: method 1, with the assumptions written down.
- A few weeks of sales and several POs from the supplier: method 3, at a service level you chose on purpose. Keep method 1 as a sense check on the result.
- A supplier with a fixed delivery schedule: method 2 is enough.
When the Formulas Break
Methods 2 and 3 assume demand that is steady, made of many small independent sales, and roughly bell-shaped. Four common cases break that.
Slow Movers
When a product sells a few units a week, daily sales are mostly zeros and ones. The bell curve doesn't fit, and the formulas can return fractions of a unit. Use a whole-unit table instead. If customers buy one unit at a time and independently, and the lead time is fixed, sales over the wait follow a Poisson distribution. The reorder point is the smallest whole number that covers the wait at your service level:
| Sales a day | Average sales over 25 days | Reorder point at 95% | Reorder point at 99% | Safety stock at 95% | Safety stock at 99% |
|---|---|---|---|---|---|
| 0.2 | 5.0 | 9 | 11 | 4 | 6 |
| 0.05 | 1.25 | 3 | 4 | 1.75, so 2 | 2.75, so 3 |
A quick test for this method: the variance of daily sales should be close to the average. If customers often buy several at once, treat the item as lumpy instead.
Lumpy B2B Orders
One wholesale order of 50 units can be bigger than all the other sales that month. A daily average and standard deviation hide that. Look at the actual sales over past waits instead: add up the sales in each rolling 25-day window and set the reorder point at the level that would have covered most of them. Overlapping windows count the same sales more than once, so you need a long history to trust it. Or plan big orders from the customer's own forecast and keep the buffer for everyday sales.
Seasonal Items and Promotions
A standard deviation measured over a whole year mixes the busy season with the quiet one. It comes out too high in the quiet months and too low in the peak. Measure it over the period you're about to face, such as the same weeks last year or the weeks since the ramp started. Leave out one-off promotion days. A planned spike belongs in the order quantity and the reorder point, not in the buffer. The reorder point guide covers what changes the reorder point in a season.
New Products
With no sales history there is no standard deviation. Use method 1 with your best guess of the demand range, taken from a similar product, and the supplier's longest likely lead time. Write the guess down. After the first two deliveries and a few weeks of sales, replace it with measured numbers and recalculate.
Choosing a Service Level: The Cost Side
The service level is a business decision, not a maths result. Each step up costs more stock, and the steps get steeper. Here is the mug under method 3:
| Service level | Chance of a stockout per cycle | Safety stock | Units short per cycle, on average |
|---|---|---|---|
| 90% | 1 in 10 | 19.9 | 0.73 |
| 95% | 1 in 20 | 25.5 | 0.32 |
| 99% | 1 in 100 | 36.1 | 0.05 |
| 99.9% | 1 in 1,000 | 48.0 | 0.004 |
The last column is the average number of mugs a cycle would be short, which is a different measure from the chance of a stockout. It falls fast, so each extra point of service level saves fewer sales than the one before.
Here is a worked comparison of 95% and 99%. The cost figures are examples, so replace them with yours. The mug's landed cost is $3.83 and it sells for $16, so each missed sale loses $12.17 in margin. Assume holding stock costs 20% of its value a year.
- Cost of moving up: 36.1 − 25.5 = 10.6 more mugs held. 10.6 x $3.83 x 20% is about $8 a year.
- What it saves: 0.32 − 0.05 = 0.27 fewer mugs short per cycle. With the mug's supplier minimum of 500, it sells through in 125 days, about 2.9 orders a year, so 0.27 x 2.9 is about 0.8 fewer missed sales. At $12.17 each, that is about $10 a year.
It is close to a wash. The choice depends on what a missed sale costs beyond the margin: a customer who doesn't come back, or a rush shipment to catch up. That is a judgement about your business. As a rule, give best sellers and items that are hard to replace a higher level, and give cheap, slow or backorderable items a lower one.
How to Review Your Safety Stock
Safety stock is only as good as the numbers behind it, and those change. Recalculate when:
- The lead time changes. Compare each delivery's actual lead time with the one you used. A new supplier, a new shipping route or a holiday closure all move it, and a slower supplier often shows up first in your own receiving dates.
- The sales rate or its spread changes. A new sales channel, a trend or a seasonal ramp changes both the average and the standard deviation.
- You have a stockout. At 95%, one cycle in twenty running out is expected. Ask which input was wrong: a late delivery, a demand spike or a stale average. That tells you which number to fix.
- A season is coming. Move the numbers at least one lead time before it starts.
For steady products, checking every month or two is often enough. Supplier minimum order quantities and carton sizes change how much you order, not the safety stock.
Where Channel Bay Fits
Channel Bay is our app, so we're not neutral here. It doesn't calculate safety stock. It has no safety stock setting and doesn't work out standard deviations or Z scores. Do the maths in the calculator or a spreadsheet, then use Channel Bay to hold the result and warn you:
- A reorder point on every product. It starts at 10 units and you can change it. Set it to lead time demand plus your safety stock, which for the mug is 100 + 26 = 126. The dashboard lists the products with a supplier whose available stock is below their reorder point, grouped by supplier. The suggested quantity is the gap up to the reorder point, rounded up to whole packs and at least the supplier's minimum.
- Days of stock left and days to reorder. Days left comes from your recent Shopify sales. Days to reorder is days left minus the lead time, and it goes negative when you're already late. Channel Bay measures the lead time from your own purchase orders, from ordering to receiving, and uses 14 days until there's enough history. It averages over your received orders, so its number can differ a little from one you work out yourself.
- No buffer in the forecast line. The reorder point line on a product's Forecast tab is sales per day x lead time, so for the mug it is the 100, not the 126. It also shows one lead time per product, not how much it varies, so take the spread from the dates on your POs.
If you want software to size safety stock for you from sales history, that is a different kind of tool. See the Shopify inventory forecasting apps compared, and check how each one sizes the buffer.
Days of stock left, days to reorder and the Forecast tab are forecasting features that not every plan includes, so check the pricing page for what each plan covers. Channel Bay is free for stores with fewer than 1,000 orders in the last 365 days. See how Channel Bay handles purchase orders.
Frequently Asked Questions
What is the safety stock formula?
How do you calculate safety stock step by step?
What Z score should you use for safety stock?
What is the difference between safety stock and buffer stock?
How much safety stock do you need for a slow-moving or new product?
Should you use the sample or population standard deviation for safety stock?

Guides from the team that builds and supports Channel Bay, the Shopify inventory app for purchase orders, stocktakes, stock transfers and multichannel stock sync. About Channel Bay