Weighted Average Cost Formula, With a Worked Example for Shopify Sellers
Work out weighted average cost with the formula and a worked example: periodic and moving versions, a spreadsheet layout, and what Shopify and Channel Bay do.
On this page
- What is the weighted average cost formula?
- Worked example: the periodic average
- Worked example: the moving average
- What the next delivery does to the average
- How to calculate it in a spreadsheet
- Mistakes that throw the average out
- Where can you use weighted average cost?
- Weighted average cost in Shopify
- Rolling Average cost in Channel Bay
- Where to start
Key Takeaways
- Weighted average cost is the total cost of the units you hold divided by the number of units: ((units in stock x current average) + (units received x unit cost)) / (units in stock + units received). Every unit then carries the same blended cost.
- It comes in two versions. The periodic average is worked out once for a period from everything available. The moving average is recalculated at each delivery, and a sale doesn't change it.
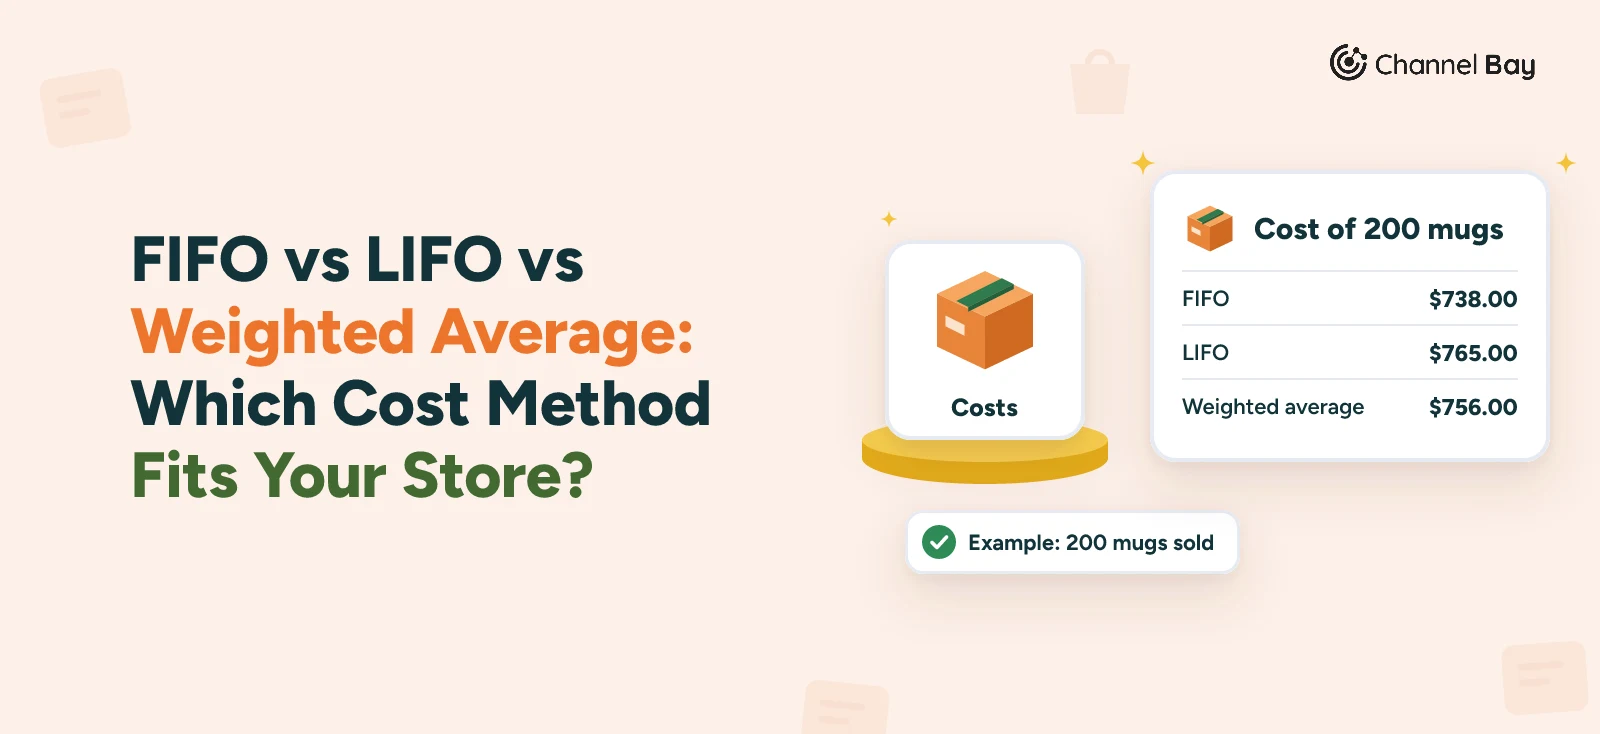
- On our invented mugs, 200 sold cost $756.00 with a periodic average of $3.78 and $748.00 with a moving average, because 60 mugs sold before the delivery at the older $3.60 cost. FIFO gives $738.00 on the same stock.
- Weight by units received, not by the prices alone. A plain average of $3.60 and $3.825 is $3.7125, which leaves $40.50 of the $2,268.00 the stock cost out of your books.
- Shopify keeps one cost per item that you type in, so you work the average out and enter it. Channel Bay's Rolling Average cost does the moving version at each purchase order receipt, from the unit cost entered when you receive.
Weighted average cost is the total cost of the units you hold divided by the number of units, so every unit carries the same blended cost. When a delivery arrives at a different price, the formula blends the new units into what you already have: ((units in stock x current average cost) + (units received x unit cost)) / (units in stock + units received).
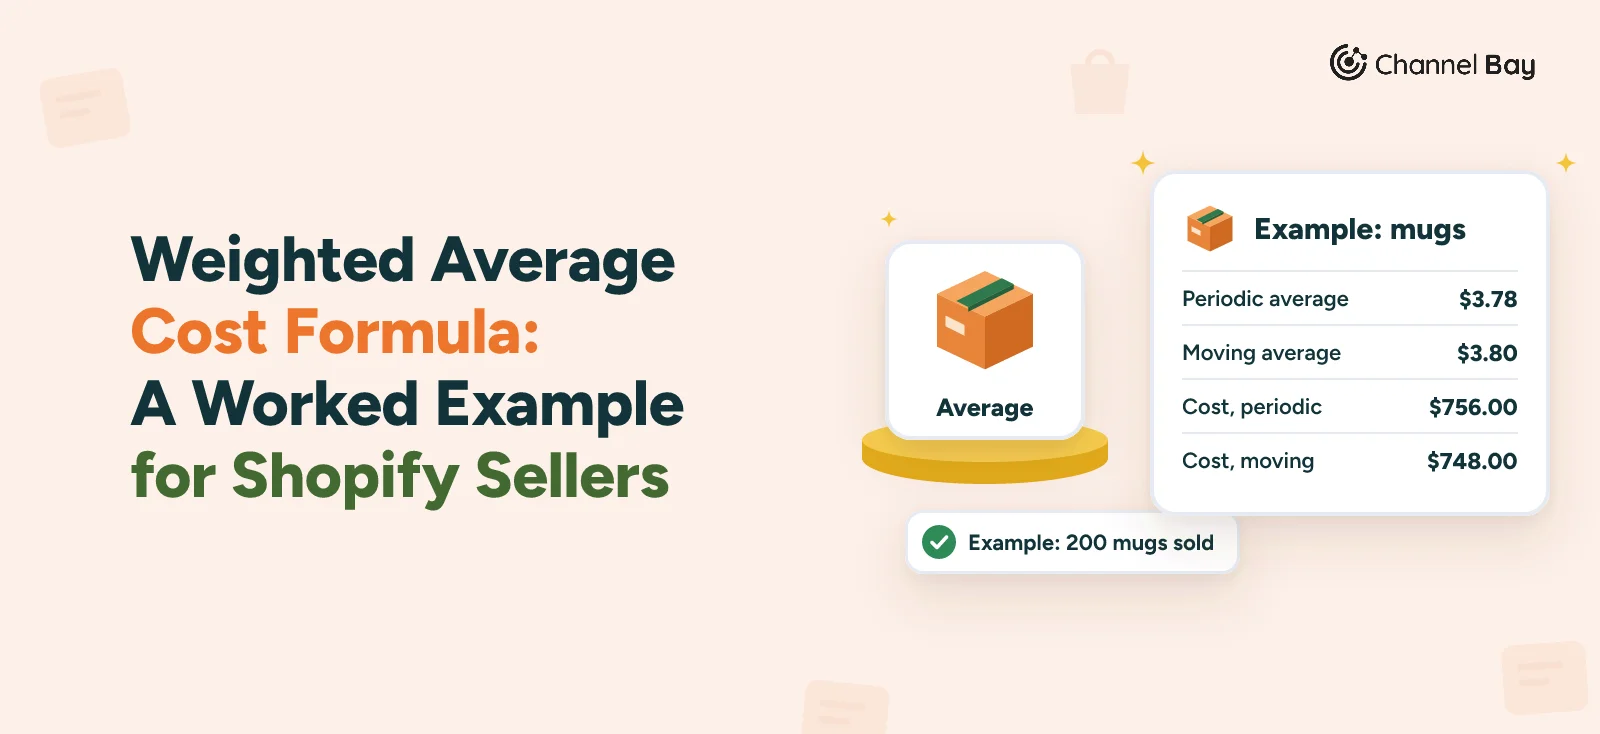
It comes in two versions, and the difference matters if you sell stock between deliveries. The periodic average is worked out once for a whole period. The moving average is recalculated at every delivery. On the invented mugs below, 200 mugs sold cost $756.00 one way and $748.00 the other.
This guide gives both formulas, runs one set of purchases through each, shows a spreadsheet layout, lists the mistakes that throw the average out and says what Shopify and Channel Bay do. Which costing method to choose is covered in our FIFO vs LIFO vs weighted average guide. This one is about the arithmetic, and none of it is tax advice. Both belong to our inventory valuation guide.
What Is the Weighted Average Cost Formula?
Cost follows quantity. A delivery of 480 mugs should move the average more than a delivery of 20, because there are more of them to carry its cost. There are two ways to apply that.
Periodic weighted average. Add up the cost of everything available in the period, meaning opening stock plus purchases, and divide by the units available:
Weighted average cost = (cost of opening stock + cost of purchases) / (opening units + units purchased)
Every unit sold in the period is costed at that one figure. Cost of goods sold is the units sold times the average, and the stock left is the units left times the average. You only know the average once the period closes, so this version suits month-end and year-end figures.
Moving average. Recalculate after each delivery:
New average cost = ((units in stock x current average cost) + (units received x unit cost)) / (units in stock + units received)
Sales between deliveries use the current average. Guides also call this a rolling or perpetual average.
Three things follow from the arithmetic:
- A sale doesn't move the moving average. Units leave at the average, so the stock and its total cost shrink in the same proportion.
- A delivery moves it by an amount that depends on the stock. The same delivery barely moves the average when the shelf is full and resets it to the delivery's unit cost when the shelf is empty.
- Cost, not price, goes into the formula. Use the same cost basis for every delivery, whether that is the unit cost on the invoice or a landed cost with freight and duty added. Our landed cost guide covers the second.
IAS 2, the international inventory standard, allows weighted average cost for interchangeable items. Paragraph 27 says the average may be calculated periodically or as each shipment is received, depending on the entity's circumstances, and paragraph 25 says to use the same cost formula for inventories of a similar nature and use (AASB 102 Inventories, the Australian text of IAS 2, read 13 November 2026).
Worked Example: The Periodic Average
Here is the formula on one set of purchases. Example, invented figures. They are the same mugs as in our FIFO guide.
| Purchase | Units | Unit cost | Cost |
|---|---|---|---|
| Opening stock | 120 | $3.60 | $432.00 |
| PO-2026-0142 | 480 | $3.825 | $1,836.00 |
| Available | 600 | $2,268.00 |
The periodic average is $2,268.00 / 600 = $3.78. The store sells 200 mugs at $16.00, so $3,200.00 of sales:
- Cost of goods sold: 200 x $3.78 = $756.00
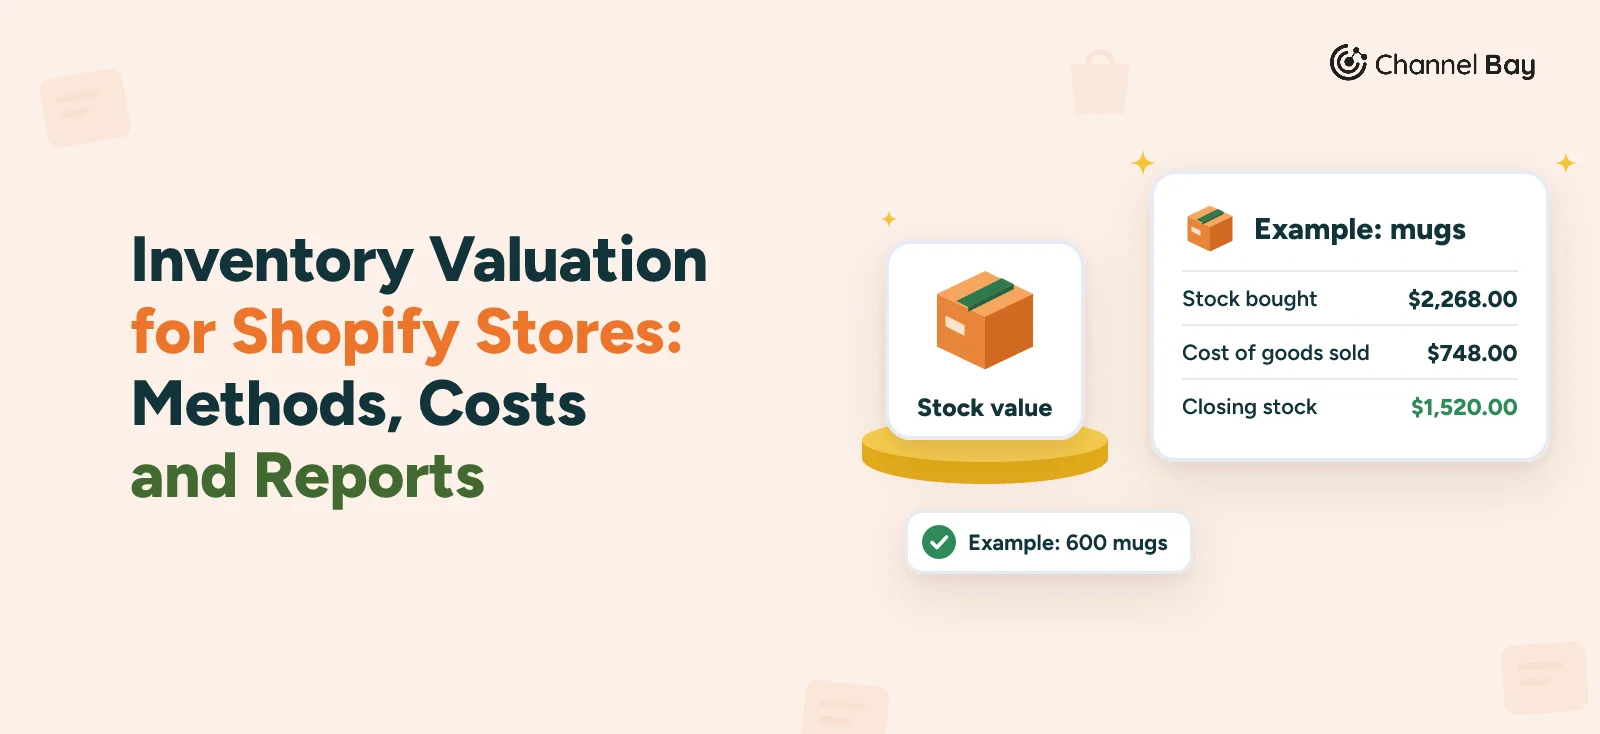
- Stock left: 400 x $3.78 = $1,512.00
- Gross profit: $3,200.00 - $756.00 = $2,444.00, or 76.4%
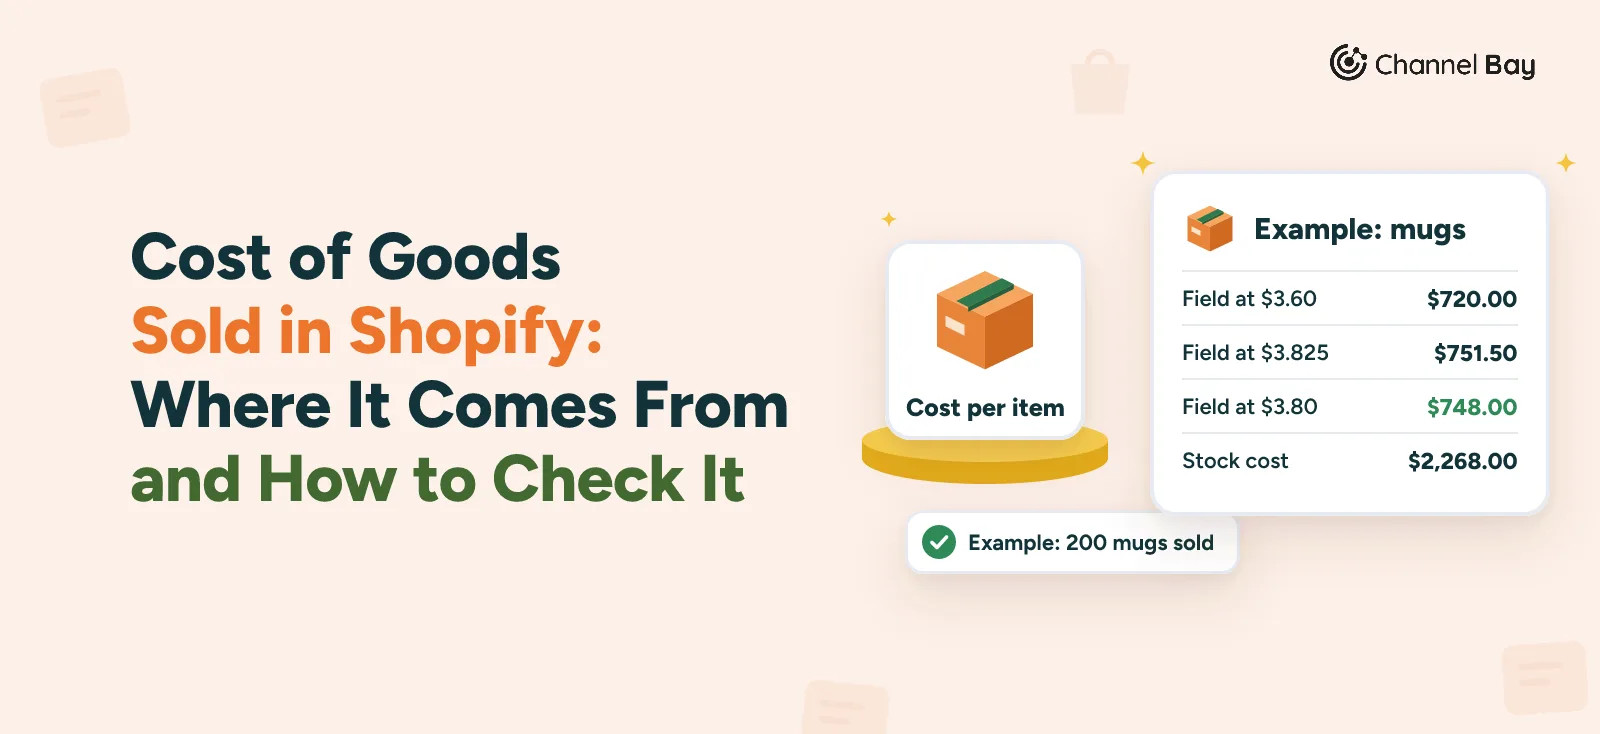
Cost of goods sold plus stock left is $2,268.00, the cost of everything available, so nothing has gone missing.
Worked Example: The Moving Average
Now the same 200 sales, but 60 of them happen before the delivery arrives. The moving average is recalculated when the 480 mugs are received.
| Step | Event | Units in stock after | Average cost | Cost of goods sold | Stock value |
|---|---|---|---|---|---|
| 1 | Opening stock, 120 mugs at $3.60 | 120 | $3.60 | $432.00 | |
| 2 | Sell 60 mugs | 60 | $3.60 | $216.00 | $216.00 |
| 3 | Receive 480 mugs at $3.825 | 540 | $3.80 | $2,052.00 | |
| 4 | Sell 140 mugs | 400 | $3.80 | $532.00 | $1,520.00 |
Step 3 is the formula in use: (60 x $3.60 + 480 x $3.825) / (60 + 480) = $2,052.00 / 540 = $3.80. The 60 mugs left from before are weighted at $3.60, the 480 new ones at $3.825.
Cost of goods sold is $216.00 + $532.00 = $748.00, the stock left is $1,520.00, and together they come to $2,268.00 again. Gross profit is $2,452.00, or 76.6%. Here are the two averages next to FIFO on the same purchases and sales:
| Method | Cost of goods sold | Stock left | Gross profit |
|---|---|---|---|
| Periodic average ($3.78) | $756.00 | $1,512.00 | $2,444.00 |
| Moving average | $748.00 | $1,520.00 | $2,452.00 |
| FIFO, for reference | $738.00 | $1,530.00 | $2,462.00 |
The $8.00 gap between the two averages comes from the 60 mugs that sold early. The moving average costs them at $3.60, what they cost when they sold, while the periodic average spreads the later $3.825 delivery back over them and costs them $10.80 more (60 x $0.18). It costs the 140 later mugs $2.80 less (140 x $0.02) than the moving average's $3.80, which leaves the $8.00 net. If all 200 had sold after the delivery, both versions would give $3.78. The two only differ when you sell between deliveries and your costs have moved, and once all the stock has sold they have expensed the same total.
Which should you use? The one your accountant files and your system supports. A store that records sales and deliveries through the month, as an inventory app does, has no period-end average to hand when a sale happens, so it tends to work with the moving version. The periodic version is the one to reach for when you work a month or a year out from the totals.
What the Next Delivery Does to the Average
Say 200 more mugs arrive at $4.20 while 400 are in stock at $3.80. The new average is ($1,520.00 + $840.00) / 600 = $3.9333, or $3.93 to the cent.
The average moves by $0.13, not the $0.40 gap between $3.80 and $4.20, because two thirds of the stock was already there. Rounding also leaves a trace: 600 mugs at $3.93 come to $2,358.00, which is $2.00 under the $2,360.00 they cost. A system that rounds each average to the cent, as Channel Bay does, drifts by a few cents across a lot of units, so its figure and a spreadsheet that keeps more decimals can differ.
How to Calculate It In a Spreadsheet
Keep one row per delivery. Column A is the units received, B the unit cost, C the units in stock before the delivery (after any sales since the last one, and 0 if your stock was negative), D the average before it, and E the new average. In E2, then copied down:
=IF(C2+A2=0, B2, ROUND((C2*D2 + A2*B2) / (C2+A2), 2))
Column D is the previous row's E, so D3 is =E2. The opening stock, the delivery and a later delivery of 200 mugs at $4.20 look like this:
| Row | Received units | Unit cost | Stock before | Average before | New average |
|---|---|---|---|---|---|
| 2 | 120 | $3.60 | 0 | $0.00 | $3.60 |
| 3 | 480 | $3.825 | 60 | $3.60 | $3.80 |
| 4 | 200 | $4.20 | 400 | $3.80 | $3.93 |
For the periodic average, multiply and add the columns once: =SUMPRODUCT(A2:A3, B2:B3) / SUM(A2:A3) gives $3.78 for rows 2 and 3, the period's opening stock and delivery. Take out ROUND if you would rather keep the full precision.
Mistakes That Throw the Average Out
- Averaging the prices instead of weighting them. ($3.60 + $3.825) / 2 is $3.7125, which ignores that 480 of the 600 mugs cost $3.825. At $3.7125, 600 mugs add up to $2,227.50, which is $40.50 short of the $2,268.00 the stock cost.
- Weighting by what you ordered instead of what arrived. If PO-2026-0142 was for 480 mugs and only 300 turned up, with 60 mugs at $3.60 in stock, the average is ($216.00 + $1,147.50) / 360 = $3.7875, not the $3.80 you get from 480. The rest arrives as its own delivery, as in our goods receipt guide.
- Counting the delivery twice. Use the stock you held before the delivery was booked. If the stock figure already includes the new units, they carry too much weight.
- Mixing cost bases. If one delivery's cost includes freight and the next doesn't, the average blends two different things. Pick unit cost or landed cost and use it every time.
- Letting negative stock into the formula. If you sold more than you had, treat the stock before the delivery as zero. A negative figure pulls the average the wrong way.
Where Can You Use Weighted Average Cost?
IAS 2 allows it, as above. For US tax, IRS Publication 538 (01/2022 text, read 13 November 2026) lists specific identification, FIFO and LIFO as ways to identify the cost of inventory, and the sections we read don't name an average cost method, so ask your accountant how it is treated. Our FIFO vs LIFO vs weighted average guide has the rules for the US, IFRS and UK tax with the sources and the date we read them. Whatever you choose, stay with it: Publication 538 says inventory practices must be consistent from year to year.
Weighted Average Cost in Shopify
Shopify's help page on cost per item names no costing method. It says to add a cost per item to each variant, and that the cost is recorded on an order when the order is created. Profit reports for past orders still use the earlier cost if you change it (Shopify Help Center, adding cost per item to products, read 13 November 2026).
So the average lives in a number you type, and you keep it right by hand. Shopify's cost of goods sold is then that number times the units sold, as our Shopify cost of goods sold guide shows on the same mugs:
- Before you book a delivery, note the units on hand and the current cost per item for the variant.
- Work out the new average with the moving formula above.
- Enter it as the cost per item before the new stock starts selling. Orders record the cost when they are created, so an order placed first keeps the old figure.
For many variants, our Shopify cost per item and landed cost guide covers the bulk editor and CSV import, and why receiving a delivery doesn't change the field. If you want to see what the stock is worth afterwards, see the Shopify inventory value report guide.
Rolling Average Cost in Channel Bay
Channel Bay is our app, so we're not neutral here. What follows is how it works as of November 2026. Its Rolling Average cost is the moving version of the formula, applied at each purchase order receipt.
- Open Integrations, then View Linked Stores, and click your Shopify store.
- Under Sync settings, turn on Cost price sync. It needs a plan with cost and retail price sync.
- Under Cost price sync, where you select which cost price to push to Shopify, choose Rolling Average cost. How it's calculated shows the formula.
- In the Enable Rolling Average Cost window, type
enableto confirm.
From then on:
- Each receipt sets the average. When you receive a purchase order, the variant's cost price becomes the new average. Sales don't change it, as in the formula.
- Stock before is the available stock across all locations, read before the receipt, so you get one average per variant, not one per location.
- The received quantity is what counts. A partial receipt averages the units that arrived, and the rest averages in when it arrives.
- The first receipt starts from the current average. The starting figure is the variant's current average cost or, if it has none, its cost price. Stock below zero counts as zero, so a receipt into an empty shelf gives that receipt's unit cost.
- Each result is rounded to the cent, as in the $3.93 above.
- The unit cost is the one entered on the receiving screen, or the line's price on the order if you leave it, converted to your account currency if the order is in another. Landed cost is worked out separately on the purchase order and isn't what the average uses.
- Shopify shows the averaged cost while cost price sync is on.
In the mug example, receiving the 480 mugs with 60 in stock gives $3.80, the figure in the moving average table. Costs already recorded aren't recalculated, because only receipts from then on are averaged, and switching back to Last received cost leaves the averaged costs already written.
FIFO or LIFO layers by location are a separate setting, Cost Tracking, which our FIFO guide compares with this one. Neither posts journal entries or exports to accounting software, and neither decides what you file, so use the method your accountant files.
Where to Start
Decide which version your accountant files, then check that each delivery's cost is right, because the average is only as good as the costs going into it. In Shopify, work out the moving average at each delivery and enter it before the new stock sells. If you would rather not do the sum each time, turn on Rolling Average cost in Channel Bay and check the first receipt against the spreadsheet above.
For what to enter as a cost in the first place, see our Shopify cost per item and landed cost guide.
Frequently Asked Questions
What is the weighted average cost formula?
What is the difference between a periodic and a moving average?
Does selling stock change the weighted average cost?
Does Shopify calculate weighted average cost?
Can I use weighted average cost for tax and accounts?

Guides from the team that builds and supports Channel Bay, the Shopify inventory app for purchase orders, stocktakes, stock transfers and multichannel stock sync. About Channel Bay