How to See Your Inventory Value in Shopify (Reports, Steps and Limits)
Shopify's Month-end inventory value report totals stock at cost per item. See where to find it, what it counts, its limits and what to use instead.
On this page
- Where do you find inventory value in Shopify?
- What does the total include and leave out?
- How is the total worked out?
- Can you see inventory value at sale price?
- Why may the figure not match your books?
- What can't Shopify's report do?
- How do you see inventory value in Channel Bay?
- A monthly routine for checking inventory value
- Where to start
Key Takeaways
- Shopify totals inventory value in the Month-end inventory value report, under Analytics, then Reports, in the Inventory category. The total is each variant's cost per item multiplied by its ending quantity, and the sum shows in the Summary row.
- From 1 October 2026 Shopify's inventory reports count On hand units instead of Available units. Committed and Unavailable units now count, so a trend that crosses that date isn't like for like.
- The report counts stock on hand and leaves out incoming transfer units. Shopify's help describes no step that values stock at sale price in this report. The ABC product analysis report has a Total value (price) column for that.
- Shopify keeps one cost per item for each variant and no history of earlier costs, so a stale cost makes the total wrong. In our example a $3.20 cost against a $3.83 landed cost takes $283.50 off the total.
- Channel Bay's Inventory on Hand report shows Value at Cost and Value at Retail by variant and location once Cost Tracking is on. It is a current view and has no date range.
Shopify shows inventory value in its Month-end inventory value report. Go to Analytics, then Reports, filter by the Inventory category, and open the report. The total is each variant's cost per item multiplied by its ending quantity, and the sum shows in the Summary row.
The number is only as good as the costs behind it, and Shopify changed what it counts on 1 October 2026. This guide covers where to find the report, what the total includes, how to see a sale-price version, why it may not match your books and what Channel Bay adds. It is part of our inventory valuation guide and sits alongside our guide to Shopify cost per item and landed cost. If you only have a minute, start with the variants that have no cost.
Where Do You Find Inventory Value in Shopify?
Shopify's help describes these steps (Shopify Help Center, inventory reports, read 12 November 2026):
- From the Shopify admin, go to Analytics, then Reports.
- Click the Category filter and choose Inventory.
- Open Month-end inventory value.
- Set the time period you want to look at.
- Read Total inventory value in the Summary row, or scan the rows for each variant.
The report lists the product title, variant title, SKU, Cost, Ending quantity and Total inventory value for each variant.
Shopify's help page doesn't mention exporting, which plans can open the report or how soon a stock change shows up. Test those in your own admin before you build a routine around them.
What Does the Total Include and Leave Out?
The report works from On hand stock. Shopify's help defines On hand as the sum of Committed, Unavailable and Available units, and says it leaves Incoming units out (Shopify Help Center, inventory states, read 12 November 2026). The inventory reports page spells out the same split:
- Available units that customers can buy.
- Committed units, meaning orders waiting to be fulfilled, units reserved in a draft order and units in a transfer marked ready to ship.
- Unavailable units set aside by apps or held for other reasons, such as damaged items, quality control or safety stock.
- Incoming units on a transfer are excluded.
So stock that is on the way doesn't count until you receive it. Our guide to seeing incoming inventory in Shopify shows where to check what is still on its way.
Four more rules on that page set the limits of the figure:
- The October 2026 change. Starting 1 October 2026, inventory reports measure On hand quantity instead of Available quantity. Shopify says reported quantities can be higher than before, and that data before that date still shows Available quantity. A value trend that crosses 1 October therefore mixes two bases.
- Short history. Inventory-based history goes back only to 1 October 2023.
- Deleted locations. Historical inventory for a deleted location doesn't display.
- Deleted products. If a product or variant was deleted after 14 January 2026, its inventory data stops displaying after the deletion date.
Shopify's help also says an ending quantity can be negative, for example when you oversell a tracked variant or don't have tracking turned on.
How Is the Total Worked Out?
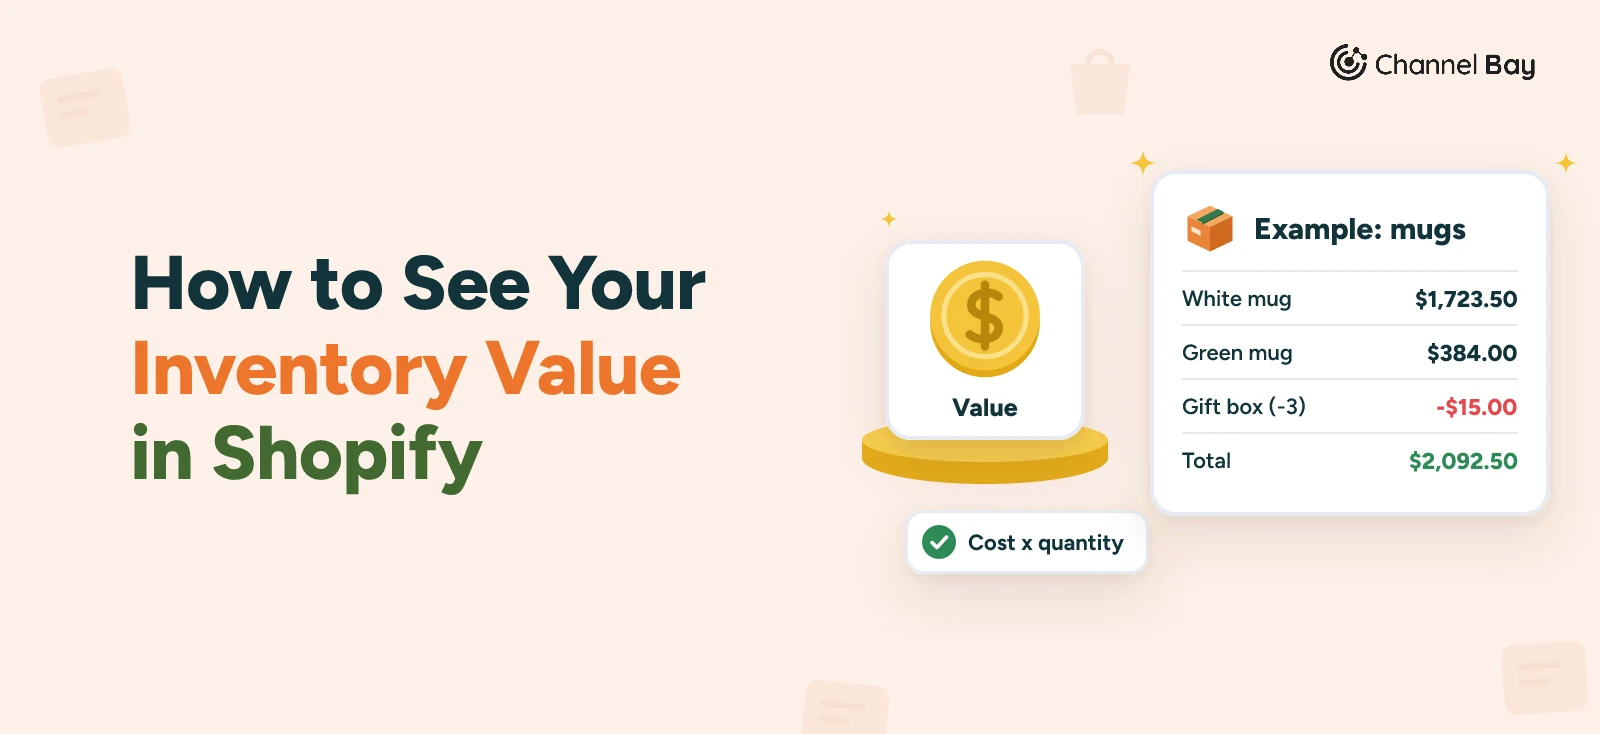
For each variant, Shopify multiplies the cost per item by the ending quantity. The Summary row adds those values up. The example reuses the mug brand from our purchase order guides. The figures below are invented and follow Shopify's formula.
| Variant | Cost per item | Ending quantity | Total inventory value |
|---|---|---|---|
| White mug | $3.83 | 450 | $1,723.50 |
| Green mug | $3.20 | 120 | $384.00 |
| Gift box | $5.00 | -3 | -$15.00 |
| Summary | $2,092.50 |
Two rows need a closer look. The first is the gift box, which was oversold by three, so its ending quantity is negative. Shopify's help describes no floor for a negative quantity in this report, so following the formula as written it takes $15.00 off the total. Check how your own report treats negative rows before you rely on the sum.
The second is the white mug's cost. It is $3.83 here because that is the landed cost of PO-2026-0142, which is the $1,836 total divided by 480 mugs (the example assumes 30 have since sold, leaving 450), as in our cost per item and landed cost guide. If the cost per item still held the $3.20 PO line price, the white mug would read $1,440.00 and the total $1,809.00, which is $283.50 lower. The report can only multiply what you entered.
One thing the help page doesn't say is whether the Cost column shows the cost at month end or today's cost. Compare one past month with your own records before you trust the history.
Can You See Inventory Value at Sale Price?
Yes, in another report. Shopify's ABC product analysis report has two value columns (Shopify Help Center, inventory reports, read 12 November 2026):
- Total value (cost), the value of the inventory at your cost.
- Total value (price), the value at the sale price, excluding discounts.
For both columns Shopify treats a negative ending quantity as a value of zero. The report also grades each variant on its share of revenue over the last 28 days, with A covering the top 80% of revenue, B the next 15% and C the last 5%, and the timeframe can't be changed.
A retail total shows what the stock would bring in if it all sold at the current list price. It isn't profit, and it isn't what your books call inventory. Use cost for accounting and price for a sense of sales potential.
Why May the Figure Not Match Your Books?
When the Summary row looks wrong, it is usually one of these:
| What you see | Likely cause | What to do |
|---|---|---|
| Value off on a variant you just restocked | Cost per item still holds the old price, and Shopify keeps one cost per variant with no history | Update it to the landed cost. See how to enter landed cost |
| A variant with stock adds nothing | No cost per item entered, and Shopify's help describes the report as covering products with a cost assigned | Fill in the missing costs |
| The total is lower than expected | A negative ending quantity from overselling, or tracking switched off | Fix the oversold variants |
| A trend jumps in October 2026 | The switch from Available to On hand | Compare months on the same basis, or note the break |
| Stock is missing from the total | It is still incoming, or it sits at a deleted location | Receive the transfer, or check the location |
| The count is simply wrong | Shelf stock differs from the system | Count it. See our stocktake guide and inventory accuracy |
If a count turns out wrong, the inventory reconciliation guide covers finding where the difference came from. To check the stock value against what Shopify reports as cost of goods sold for the month, see our Shopify cost of goods sold guide.
What Can't Shopify's Report Do?
Three limits matter for valuation:
- It is a month-end report. Shopify's help describes it as a month-end snapshot and doesn't list a value as of today, so a mid-month figure needs a different report or a tool.
- It has one cost basis. Shopify keeps one cost per item for each variant, as our cost per item guide explains, so there is no choice between FIFO, LIFO and a weighted average (our FIFO vs LIFO vs weighted average guide compares them and our weighted average cost formula guide shows the arithmetic), and no earlier costs to look back at.
- Its history is limited. The history and deleted-location rules above apply to every month you look back at.
If you need a current view by location, or value that follows the cost of each delivery, you need something that records costs as stock arrives. That is where an app comes in. Our Shopify inventory report feature page shows the reports Channel Bay offers.
How Do You See Inventory Value in Channel Bay?
Channel Bay is our app, so we're not neutral here. This is how it works as of November 2026.
- Where. Go to Reports, then Inventory on Hand. Each row is one variant at one location. It is a current view, so there is no date range.
- Columns. On Hand, Committed, Available, Incoming, Cost Price, Avg Unit Cost, Selling Price, Value at Cost, Value at Retail, Potential Gross Profit and Margin %. Open Columns to show, hide or reorder them.
- Filter and export. A Location filter narrows the table to one or more locations. Save keeps the view and Export CSV exports it.
- Cost columns need Cost Tracking. Cost Price is the cost held in Shopify. Avg Unit Cost, Value at Cost, Potential Gross Profit and Margin % stay hidden until Cost Tracking is on.
Cost Tracking records what stock cost at each location in layers and uses FIFO or LIFO to decide which cost a sale or removal uses. In short:
- The account owner turns it on, for Shopify stores only, and it needs Cost price sync to be on first. That needs a plan with cost and retail price sync, which Pro has by default.
- Tracking opens with a balance for each variant at its current cost price.
- Purchase order receipts add a layer at the received unit cost. Manual adjustments are held for your review so you can confirm the cost.
- It doesn't change the cost price on your products or what Cost price sync sends to Shopify.
Some limits to know about:
- A current view only. Inventory on Hand has no date range. The report catalogue lists Month-End Inventory Value and Stock on Hand as of Date for past dates, but both are marked as coming soon at the time of writing, so we don't describe them here.
- Check the Value at Cost column. Compare a row against your own figures before you rely on the total.
- Shopify only. Cost Tracking is available on Shopify stores only.
Channel Bay is free for stores with fewer than 1,000 orders in the last 365 days, and the paid plans are on the pricing page.
A Monthly Routine for Checking Inventory Value
Pick one day each month, ideally just after the month ends:
- Fix variants with stock and no cost per item.
- Update costs for the deliveries you received this month.
- Run the Month-end inventory value report and note the Summary row.
- Compare it with your books on the same date and look into any gap.
- Write down any cost changes, because Shopify keeps no history of them.
Where to Start
Open Analytics, then Reports, filter by Inventory and run Month-end inventory value for last month. Work through the variants with no cost and any negative ending quantity, then compare the Summary row with your books before you use it for anything else.
Frequently Asked Questions
Does Shopify show inventory value at sale price?
Does Shopify's inventory value include incoming stock?
Why did my inventory value change in October 2026?
Why doesn't my Shopify inventory value match my accountant's?
Can I see Shopify inventory value by location?

Guides from the team that builds and supports Channel Bay, the Shopify inventory app for purchase orders, stocktakes, stock transfers and multichannel stock sync. About Channel Bay