Shopify Cost of Goods Sold: Source and How to Check It
Shopify works out cost of goods sold from the cost per item on each order. See where to find it, what it leaves out, and how to check it against your books.
On this page
- Where does cost of goods sold come from in Shopify?
- Where to find cost of goods sold in Shopify
- What the number counts and what it leaves out
- How the accounting formula differs
- Worked example: three ways to fill the field
- How to check your Shopify cost of goods sold each month
- Which cost should go in the field?
- Cost of goods sold with Channel Bay
- Where to start
Key Takeaways
- Shopify's cost of goods sold is a running total of costs recorded sale by sale, not a count of stock. A sale made while the cost per item field was empty or out of date is left out or carries the old figure, and nothing corrects it afterwards.
- You'll find it in Analytics > Reports: the Finance Summary's Gross profit breakdown and the Cost of goods sold report in the Finances category, and Gross profit by product in the Profit Margin category. Sales made with no cost recorded are left out.
- The accounting formula runs the other way: opening stock plus purchases (and freight-in) less closing stock. The two routes should agree, and the gap between them shows which costs are wrong.
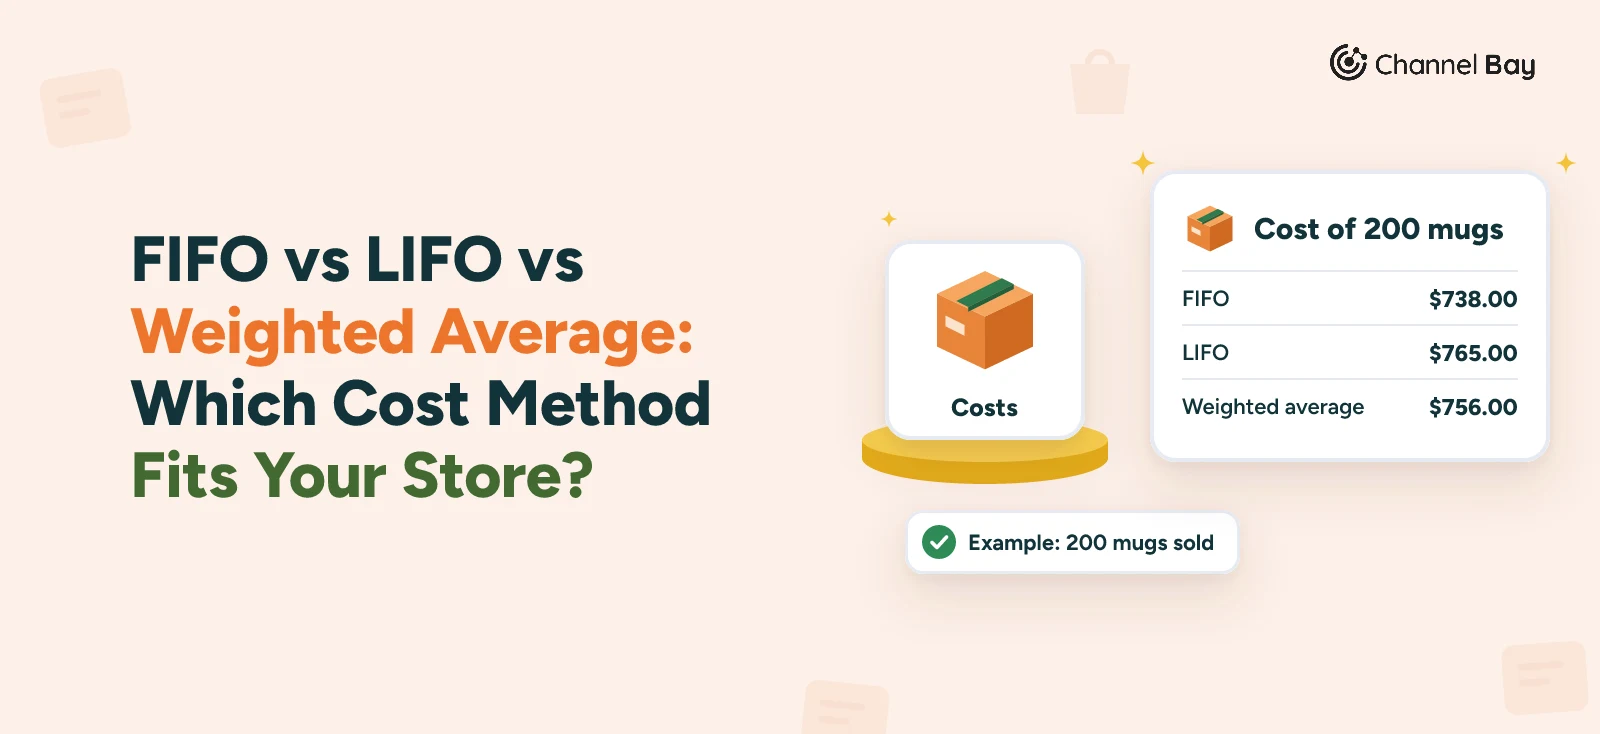
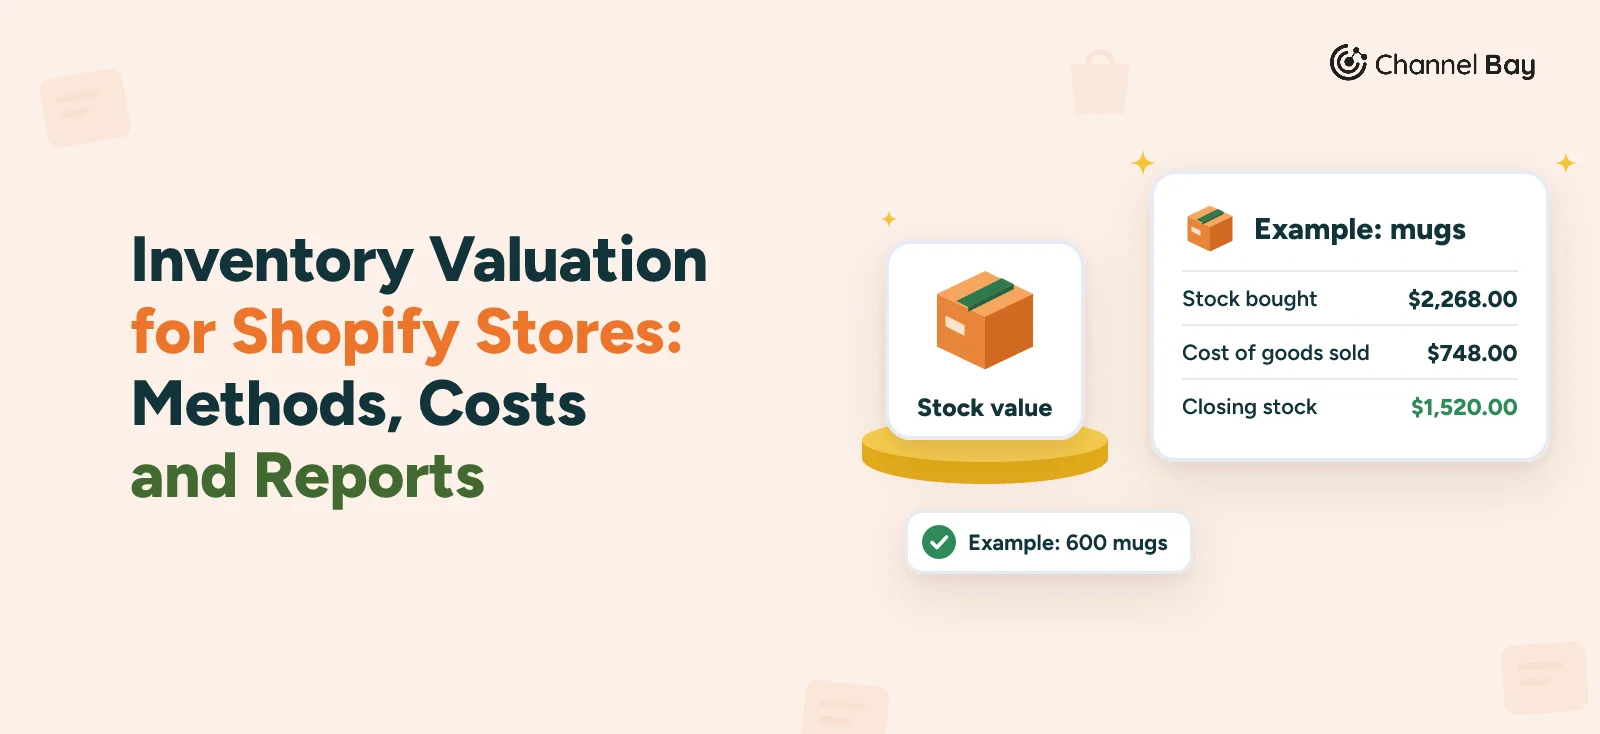
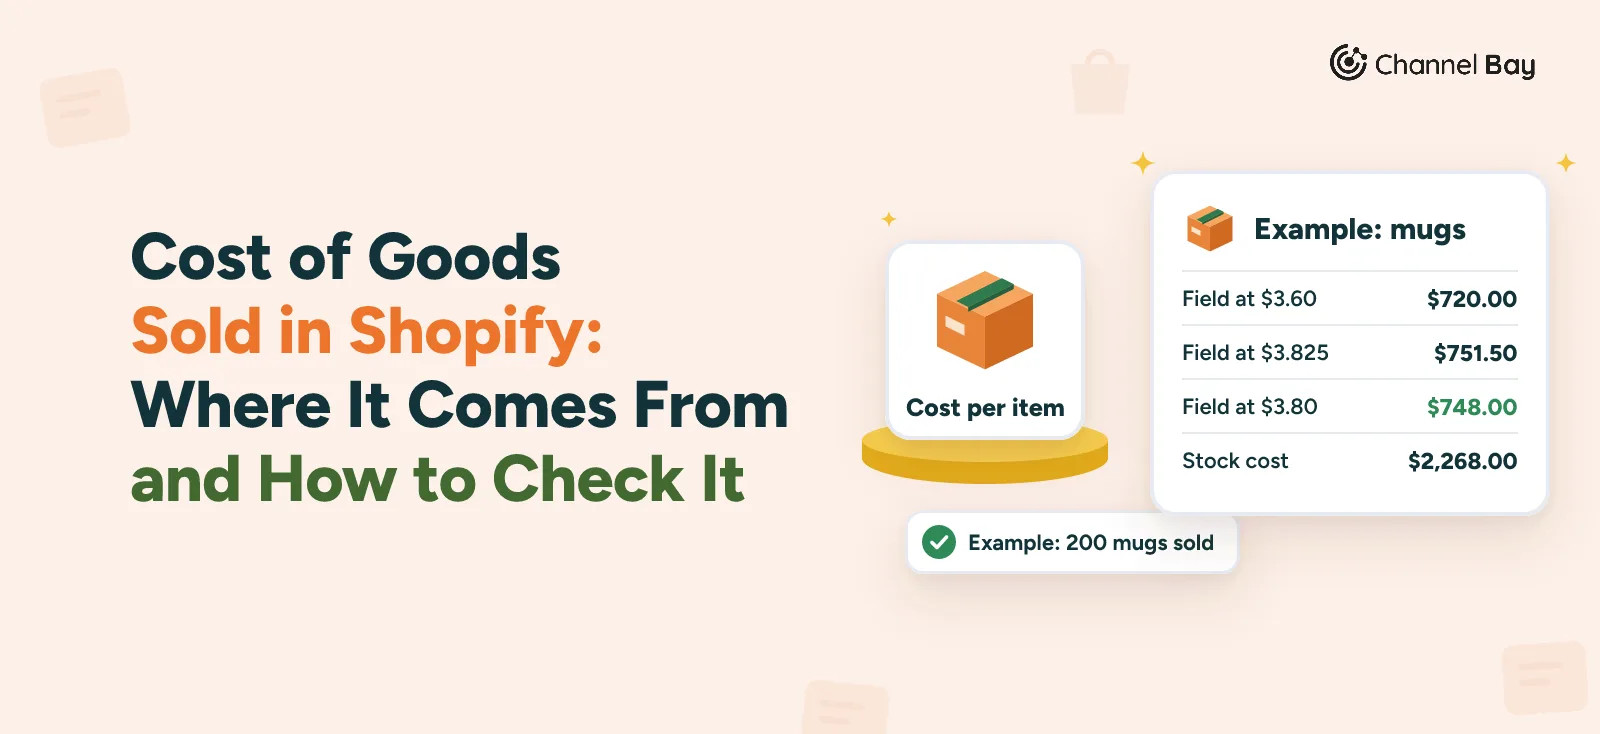
- On our invented mugs, 200 sold cost $720.00 if the field never changed, $751.50 if it moved to the latest cost and $748.00 if it moved to the moving average. Only the last one makes cost of goods sold plus closing stock equal the $2,268.00 the stock cost.
- Channel Bay can pull costs in from purchase order receipts and push the last received or rolling average cost to Shopify, and Cost Tracking costs sales from FIFO or LIFO layers, which Shopify's own reports don't use.
Shopify doesn't work out cost of goods sold from your purchases. It takes the cost per item recorded on each order line when the order is created and adds those costs up, so Shopify's cost of goods sold is whatever was in the cost per item field on the day of each sale. If the field was empty, the sale is left out. If it held last quarter's price, the sale carries last quarter's price.
This guide shows where Shopify reports cost of goods sold, what it counts and leaves out, and how it differs from the accounting formula. It then runs the same mugs as our other costing guides through three ways of filling the field, and gives a monthly check that tells you whether the number can be trusted. It is part of our inventory valuation guide, and none of it is tax or accounting advice.
Where Does Cost of Goods Sold Come From in Shopify?
Shopify keeps no cost ledger. It has one field, Cost per item, in the Price section of each product and variant. Its help says the cost is recorded on an order when the order is created, that a changed cost isn't applied to orders created before the change, and that a product with variants needs a cost on each variant (Shopify Help Center, adding cost per item to products, read 13 November 2026). The cost column in the profit reports is the total cost of the units sold in the period (Shopify Help Center, profit reports, read 13 November 2026).
Three things follow:
- Cost of goods sold follows the field, not your purchases. Receiving stock doesn't change it. Our guide to Shopify's cost per item field covers why a received purchase order isn't documented to move the field.
- The field holds what you put in it. Shopify's help suggests the price you paid the manufacturer, leaving out taxes, shipping and other costs, and for products you make, a figure based on labor and materials.
- No costing method is named. The help describes one cost per variant. If you want FIFO, LIFO or an average, the choice is made by what you type into the field. The FIFO vs LIFO vs weighted average guide compares them.
Where to Find Cost of Goods Sold in Shopify
Shopify reports it in two places, both under Analytics > Reports.
Finances. Use the Category filter, choose Finances and open Finance Summary. Its Gross profit breakdown card splits Net sales into Net sales with cost recorded and Net sales without cost recorded. Only the first is included in the Cost of goods sold report and counts toward Gross profit (Shopify Help Center, finance reports, read 13 November 2026).
Profit Margin. Use the Category filter and choose Profit Margin. The reports in it:
| Report | What it shows |
|---|---|
| Gross profit by product | Net quantity, Net sales, Cost, Gross margin and Gross profit for each product |
| Gross profit by product variant | The same columns for each variant |
| Gross profit by POS location | The same columns for each point of sale location |
| Profit margin by order | Margin for each order, with product charges, shipping charges, duties and import taxes charged to customers, and product costs, shipping costs, duties and import taxes paid by your store |
| Average profit margin by market | Profit metrics grouped by market, with the same kinds of charges and costs |
Gross margin is (net sales - cost) / net sales x 100, and gross profit is net sales less cost (Shopify Help Center, profit reports, read 13 November 2026). The two order and market reports list shipping, duties and import taxes your store pays next to product cost, so don't compare their margins with the product reports' margins without checking what each includes.
What the Number Counts and What It Leaves Out
- Only sales with a cost recorded. A sale of a variant that had no cost per item when it sold isn't in cost of goods sold or gross profit, which is why net sales in your profit reports can be lower than in your sales reports. Shopify's help describes no way to add a cost to a sale that was already made.
- The cost on the day. Past orders keep their old cost. Update the field when a dearer delivery arrives, and orders created before the update stay at the old figure.
- Net sales, so discounts and refunds change the margin. Example, invented figures. A mug at $16.00 with a $3.60 cost shows a 77.5% margin on the product page. Sold at $12.00 after a 25% discount, it shows 70.0% in the profit report, because Shopify's help says the report's gross margin is based on net sales. The help doesn't spell out how the cost of a refunded unit is treated, so check one refunded order against the report before you rely on it.
- Whatever the field holds. If it holds the supplier price, freight and duty are outside your cost of goods sold. Our landed cost guide covers what goes into a full cost.
- Units sold, not units lost. The cost column is the cost of units sold. Stock that was damaged, lost or written off has no sale to carry a cost, and Shopify's help doesn't say it appears there. See inventory write-offs and inventory shrinkage.
Shopify's help calls the field static data, so the profit reports are only right for a point in time (profit reports, read 13 November 2026). Its own suggestions for anything more dynamic are to run financial reports in an accounting or ERP system, use a reporting app for the value of your inventory, or work costs, profits and losses out by hand.
How the Accounting Formula Differs
Accounts work the other way round. Instead of adding up a cost for each sale, they start from stock. For a business that buys goods for resale, IRS Publication 334 works cost of goods sold out as the inventory at the start of the year, plus purchases, plus freight-in on the merchandise, less the inventory at the end (IRS Publication 334 (2025), chapter 6, read 13 November 2026). The same arithmetic works for a month:
Cost of goods sold = opening stock value + purchases + freight-in - closing stock value
The publication counts freight-in as part of cost of goods sold, while Shopify's help suggests leaving shipping out of the cost per item. A store that follows the help to the letter has a Shopify figure lower than the formula's. The formula also sweeps in stock that disappeared, because lost stock lowers the closing value. These are US rules, so ask your accountant what applies where you file.
If every cost is right, the two routes agree. When they don't, the gap tells you which cost is wrong.
Worked Example: Three Ways to Fill the Field
Here are the mugs from our weighted average cost guide. Example, invented figures. The store has 120 mugs at $3.60 and receives 480 at $3.825, so $2,268.00 of stock is available. It sells 200 mugs at $16.00, a total of $3,200.00. 60 sell before the delivery and 140 after, and 400 are left.
The field starts at $3.60. What it holds after the delivery decides what the 140 later orders record:
| Cost per item after the delivery | Cost of goods sold | Closing stock at the field | Cost of goods sold plus closing stock | Gap to the $2,268.00 available | Gross profit |
|---|---|---|---|---|---|
| Never updated, $3.60 | $720.00 | $1,440.00 | $2,160.00 | -$108.00 | $2,480.00 |
| Latest cost, $3.825 | $751.50 | $1,530.00 | $2,281.50 | +$13.50 | $2,448.50 |
| Moving average, $3.80 | $748.00 | $1,520.00 | $2,268.00 | $0.00 | $2,452.00 |
The arithmetic: 60 x $3.60 = $216.00 for the early orders in every row. The later 140 cost $504.00, $535.50 or $532.00. Closing stock is 400 units at the field.
- Never updated. Shopify reports $720.00, which is $18.00 under the $738.00 a FIFO ledger gives for the same sales. The stock is valued at the old cost too, so the $108.00 the delivery cost above $3.60 (480 x $0.225) appears nowhere.
- Latest cost. The field moves to $3.825 when the delivery arrives, which re-prices the 60 older mugs by $0.225 each. That is $13.50 of cost that was never spent. Against the moving average, $3.50 of it lands in cost of goods sold and $10.00 in closing stock.
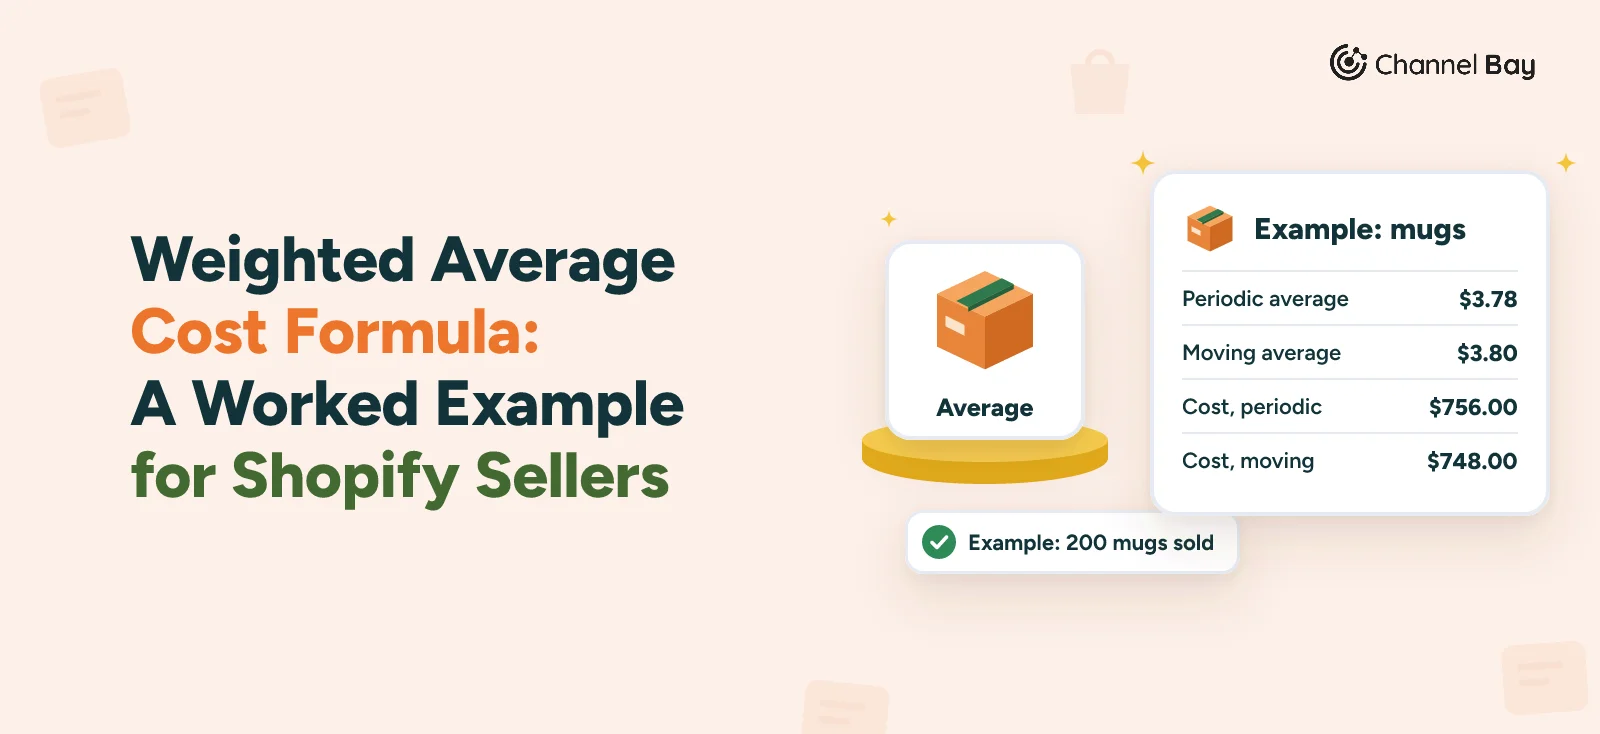
- Moving average. The field moves to $3.80, which is the average of the 60 mugs at $3.60 and the 480 at $3.825. Cost of goods sold plus closing stock then equal what the stock cost, and cost of goods sold is the $748.00 from our weighted average guide.
If 20 of the 200 had sold before anyone entered a cost, Shopify's cost of goods sold would cover 180 mugs and Net sales without cost recorded would show their $320.00. The sum wouldn't balance either, and nothing in the profit reports would say why.
How to Check Your Shopify Cost of Goods Sold Each Month
Run the check on the first of the month, before you change any costs, so the figures still reflect the field as it stood.
- Look for sales with no cost. In Finance Summary, check Net sales without cost recorded for the month. Anything above zero is a variant that sold without a cost. Add the costs now, though those sales stay out of cost of goods sold.
- Note cost of goods sold for the month, from the Cost of goods sold report or the Cost column of Gross profit by product.
- Note the stock values. Use the Month-end inventory value report, which totals cost per item times ending quantity for each variant (Shopify Help Center, inventory reports, read 12 November 2026), for the end of last month and the end of this one. Our inventory value report guide has the steps and what it counts.
- Add up purchases at cost. Use your purchase orders and supplier invoices for what you received in the month, with freight-in if you count it in cost.
- Check the sum. Opening stock + purchases - cost of goods sold - closing stock - stock written off should be zero.
A gap points at a cause:
| What you see | Likely cause | What to do |
|---|---|---|
| Net sales without cost recorded is above zero | Variants sold with no cost per item | Add the costs, and set them when products are created |
| Cost of goods sold plus closing stock is below what was available (-$108.00 in the example) | The field wasn't raised when a dearer delivery arrived | Update the field on the day you receive stock |
| It is above what was available (+$13.50 in the example) | The field moved to the latest cost while older stock was still on the shelf | Use a moving average instead of the last cost |
| Your books show a higher cost of goods sold | The field holds supplier price without freight or duty, or stock was lost | Enter a landed cost, and book write-offs separately |
| A product's margin looks too high or too low | A cost that was typed wrongly or copied from another variant | Check the cost on each variant of that product |
Which Cost Should Go in the Field?
What you type decides which cost of goods sold Shopify reports:
| What you type | Cost of goods sold you get | Suits |
|---|---|---|
| The supplier price from the last purchase order | The last price, with freight and duty left out | Quick product margins |
| The landed cost of the last delivery | The last landed cost, which re-prices older stock | Margins close to what restocking costs now |
| A moving weighted average of landed or unit costs, updated at each delivery | Moving average cost of goods sold, which reconciles as in the example | Books that use average cost |
| The cost of the layer being sold, FIFO or LIFO | Needs a ledger, because one field can't hold layers or locations | Books that use FIFO or LIFO |
Our weighted average cost formula guide has the formula and a spreadsheet layout, and our landed cost guide for Shopify has the steps for updating the field one product at a time and in bulk.
Cost of Goods Sold With Channel Bay
Channel Bay is our app, so we're not neutral here. What follows is how it works as of November 2026.
Costs come in at receiving. Each purchase order line has a unit cost, and the receiving screen lets you change it as you receive. Importing received items from a CSV fills unit costs and receive quantities from a file, and a supplier's catalog can carry unit costs imported from a CSV. Sync cost from Shopify goes the other way: it copies Shopify's cost per item into a supplier's unit costs, for one supplier or several, on every plan, and changes nothing in Shopify.
Costs go to Shopify through Cost price sync. With Cost price sync on, a cost added or changed in Channel Bay is synced to Shopify, so new orders record it. It needs a plan with cost and retail price sync. Under Select which cost price you want to push to Shopify, choose Last received cost, the unit cost from the latest receipt, or Rolling Average cost, the moving average from the example. Both use the unit cost entered at receiving, and landed cost isn't used. The formula and the steps to turn it on are in that guide.
Cost Tracking costs each sale from a layer. It needs Cost price sync to be on, and it keeps FIFO or LIFO cost layers for each location. Shipped orders use up layers in the order you choose.
A variant's Cost Tracking tab lists each location's tracked units and value, its layers, and under Recent consumption the layer and cost behind each sale. Cost columns in Channel Bay's reports, including estimated cost of goods sold, gross profit and margin, need Cost Tracking and stay hidden until it's on.
Cost Tracking doesn't change the cost per item in Shopify. Shopify's profit reports keep using the cost recorded on each order, and Channel Bay's cost figures come from the layers, so the two can differ. Run the monthly check against whichever figure your accountant files. Channel Bay doesn't post journal entries to your accounts, so the number that goes into your books still comes from you or your accountant.
Where to Start
Look at Net sales without cost recorded in Finance Summary first, because those sales are missing from every figure above. Then decide which cost belongs in the field and when you'll update it, and run the check at the next month end.
For what to put in the field in the first place, see our Shopify cost per item and landed cost guide.
Frequently Asked Questions
Does Shopify calculate cost of goods sold?
Where do I find cost of goods sold in Shopify?
Why is my Shopify cost of goods sold lower than my accountant's?
Does changing cost per item change cost of goods sold on past orders?
Does Shopify use FIFO, LIFO or average cost?

Guides from the team that builds and supports Channel Bay, the Shopify inventory app for purchase orders, stocktakes, stock transfers and multichannel stock sync. About Channel Bay