Inventory Accuracy: How to Measure It, What's Good and How to Improve It
Inventory accuracy is how closely your records match your shelves. See four formulas on one worked count, what a good rate is and how to improve it.
On this page
- What is inventory accuracy?
- How to calculate inventory accuracy
- What is a good inventory accuracy rate?
- How to set a tolerance
- How often to measure inventory accuracy
- Why inventory accuracy matters
- How to improve inventory accuracy
- Measuring inventory accuracy in Shopify, on Amazon and in Channel Bay
- Common inventory accuracy mistakes
Key Takeaways
- Inventory accuracy is how closely your system quantities match the shelf. On the 10-line count in this guide the same result reads 40% (exact match), 70% (within tolerance), 97.6% (units) or 96.9% (value), so always state the formula and tolerance next to the number.
- Avoid dividing total counted units by total expected units. Overstated and understated lines cancel, and the same count scores 98.8%. Compare line by line.
- There is no standard rate for online sellers, and the published benchmarks may not measure the same thing. Count your baseline, then set a target by class, tighter for A items and for stock sold on more than one channel.
- An overstated record is the costly kind. A mug record 40 units too high delays its reorder by 10 days and shrinks a 50-mug safety buffer to 10.
- Measure after every count, on confirmed counts, by class. Then fix where stock moves without the record: receiving, returns, transfers, channel sync and unexplained adjustments.
Inventory accuracy is how closely the quantities in your system match what is physically on your shelves. You measure it by counting stock, comparing each count with the system's quantity and turning the result into a percentage. The simplest version divides the lines within your tolerance by the lines counted. The catch is that the last step has more than one formula, and the same count can score 40% or 98.8% depending on which you pick. This guide runs four formulas on one 10-line count, covers what a good rate is, how to set a tolerance, how often to measure, and how to raise the number. It sits beside the stocktake guide, which covers how to run a count, and the cycle counting guide, which is one way to keep accuracy up all year.
What Is Inventory Accuracy?
Inventory accuracy, also called inventory record accuracy or stock accuracy, is the match between your inventory records and the real stock. Most sellers mean quantity on hand, but a record can be wrong in other ways. A 2001 review of cycle counting treats a record as inaccurate if there is an error in any of its stock number, location, quantity on hand or condition code, and reports accuracy as the share of records examined that are accurate (Rossetti, Collins and Kurgund, 2001). This guide measures quantity, because it is the field a count checks and the one that drives overselling and reordering.
An error has a direction, and the direction matters. Auburn University's RFID Lab calls a record overstated when the system shows more units than the shelf holds, and understated when the shelf holds more than the system shows (Auburn RFID Lab, Inventory Accuracy whitepaper, 2023). Overstated records are the ones that let you sell stock you do not have and reorder too late. Understated records hide stock you could sell.
How to Calculate Inventory Accuracy
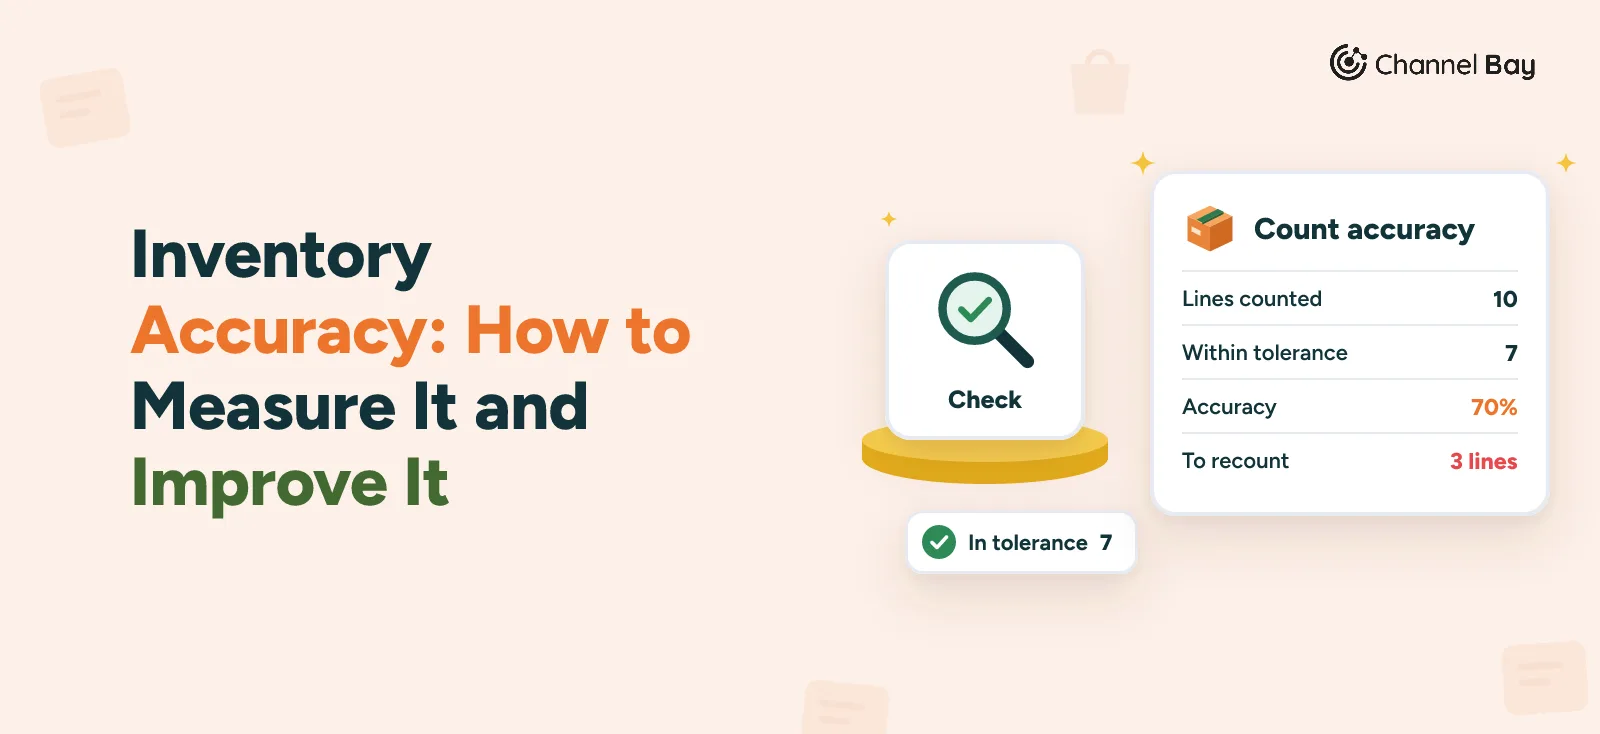
Start with a count where every line has an expected quantity (what the system says) and a confirmed counted quantity, after any recounts, so a counter's slip is not blamed on your records. Here is a 10-line count for a hypothetical kitchenware brand. The figures are made up. A line is within tolerance if it is off by no more than 5% of expected units and no more than $50 at cost, the same rule as in the stocktake guide.
| Product | Unit cost | Expected | Counted | Variance | Value of variance | Within tolerance? |
|---|---|---|---|---|---|---|
| White mug, 12 oz | $3.20 | 410 | 410 | 0 | $0.00 | Yes |
| Blue mug, 12 oz | $3.35 | 150 | 148 | -2 (-1.3%) | -$6.70 | Yes |
| Tote bag | $4.10 | 220 | 220 | 0 | $0.00 | Yes |
| Tea towel | $2.40 | 300 | 291 | -9 (-3.0%) | -$21.60 | Yes |
| Glass jar, small | $1.80 | 520 | 520 | 0 | $0.00 | Yes |
| Glass jar, large | $2.60 | 260 | 240 | -20 (-7.7%) | -$52.00 | No |
| Oak chopping board | $14.00 | 40 | 36 | -4 (-10.0%) | -$56.00 | No |
| Kettle | $22.00 | 18 | 18 | 0 | $0.00 | Yes |
| Spoon set | $5.50 | 85 | 97 | +12 (+14.1%) | +$66.00 | No |
| Teapot | $9.00 | 30 | 29 | -1 (-3.3%) | -$9.00 | Yes |
| Total | 2,033 | 2,009 | -24 | -$79.30 | 7 of 10 |
The expected stock is worth $6,742.00 at cost. Here are four ways to score this one count:
| Measure | Formula | Result | What it tells you |
|---|---|---|---|
| Exact match, by line | Lines where counted = expected ÷ lines counted | 4 ÷ 10 = 40% | How often a record is exactly right. Ignores how big the miss is |
| Within tolerance, by line | Lines inside your tolerance ÷ lines counted | 7 ÷ 10 = 70% | How often a record is good enough to trust |
| Units | 1 − (sum of absolute variances in units ÷ expected units) | 1 − 48 ÷ 2,033 = 97.6% | How much of the stock is wrong. Big-quantity lines dominate |
| Value | 1 − (sum of absolute variances at cost ÷ expected value at cost) | 1 − $211.30 ÷ $6,742.00 = 96.9% | How many dollars are wrong |
"Absolute" means each line's miss counts as a positive number, whether it is a shortage or a surplus. The line measures answer "Can I trust this record?" The units and value measures answer "How much is wrong?" Auburn's lab compares several ways of scoring accuracy in stores. Its units formula, which it calls sum of absolute variance, is 1 − Σ|Actual − On-Hand| ÷ Σ On-Hand, the same as the units row above. It notes that exact match ignores the size of a miss, and it proposes a fourth measure, SMAPE, as a standard for retailers, which is a heavier calculation than most sellers need. The value row applies the same formula to dollars, and is our adaptation, not Auburn's.
The Formula to Avoid
Shopify's own guide divides the units you count by the units your system records, 500 ÷ 550 = 90.9% in its example (Shopify, Inventory accuracy, 2022). On the count above that is 2,009 ÷ 2,033 = 98.8%, which looks excellent while three lines in ten are outside tolerance. The problem is that overstated and understated lines offset each other. Auburn calls this total magnitude measure a poor measure of true inventory accuracy, and notes that offsetting errors can make it report 100%. The same trap hides in the net variance: the count above nets to -$79.30, but $145.30 of stock went missing and $66.00 turned up, which is the point the stocktake guide makes about reporting gains and losses separately.
Which One to Use
Pick one headline measure and keep it. We suggest the within-tolerance line rate, with the value measure beside it. The line rate tells you how healthy your process is. The value measure tells you what the misses cost. Whichever you choose, write the formula and the tolerance next to the number, so a 70% this month can be compared with a 70% next month.
Two edge cases. A line whose expected quantity is zero has no percentage, so treat any units found there as a miss. And once a line is recounted, measure against the confirmed count, but also track how many lines missed on the first count. That second number shows how reliable your counting is, apart from your records.
What Is a Good Inventory Accuracy Rate?
There is no standard rate for online sellers, and we found no study of one in the sources we read. The figures that do exist come from other settings and may not measure the same thing, so they should not be lined up in one table.
- Manufacturing planning. The 2001 review quotes a source saying planning systems need 95% or more accurate records. The authors' own benchmarking of more than 20 companies found the best performers at 99% or better. It also reports an Oliver Wight survey of 410 manufacturers, in which 20% reached 98% or more and over 60% reached 90% to 97%.
- Retail. Across retailers, Auburn's RFID Lab reported inventory accuracy from 28% to 80%, around 60% on average, counted as the share of SKUs that were accurate in the retailer's system. The authors say the sample may be positively biased, and that RFID pilots exceeded 95% (Hardgrave and Cromhout, Auburn RFID Lab, 2014). In a study of nearly 370,000 records at 37 stores of one retailer, 65% did not match what was on the shelf (DeHoratius and Raman, Management Science, 2008).
The 2014 Auburn paper also makes a point worth keeping: retailers who say their accuracy is 98% are often unable to say how they know. A count is how you check.
So do not borrow a number. Count a baseline over two or three counts of each class, set a target for each class a little above where you are, and raise it as the misses are fixed. Be tighter on A items and on anything sold on more than one channel, where one wrong number can oversell on both. Compare your rate with someone else's only if the formula and tolerance match.
How to Set a Tolerance
A tolerance is the miss you accept without a recount, and it changes the score. On the count above, a zero-tolerance exact match gives 40% and a 5% and $50 tolerance gives 70%. A looser tolerance is not cheating, but it must be stated.
The 2001 review reports a 1980 APICS cycle counting training guide that suggested 0.5% for A items, 1% for B and 5% for C, and cites Stahl, who suggests that tolerance should depend on value, usage, lead time, counting method and how critical the item is. On a shelf of a dozen units, 0.5% means any difference at all. A practical version for a small seller is the one in our cycle counting guide: recount any difference on A items, and on B and C items recount anything off by more than 5% of expected units or more than $50 at cost.
A line inside tolerance still gets its adjustment posted, so the record matches the shelf. Tolerance decides whether the line counts as a miss in your accuracy figure and whether it is recounted.
How Often to Measure Inventory Accuracy
Every count is a measurement, so work out the figure after each one. The sources we read set no standard interval. This is the rhythm that follows from the counting schedule:
- Cycle counts. At 5 lines a day you count about 100 lines a month, so a monthly figure is steady enough to read. The cycle counting guide shows the schedule.
- Year-end count. The physical inventory count gives one reading across every line. Compare it with what your cycle counts showed during the year.
- By class. Report A, B and C items separately. A single blended figure lets a clean C list hide a failing A list.
- Enough lines. With 10 lines, one line moves the rate by 10 points, and by-class figures from 20 to 40 lines a month will bounce around. Read a quarter, not a month, and treat about 100 lines as a rough minimum for a figure you act on.
Why Inventory Accuracy Matters
Take the mug from our reorder point guide: it sells 4 a day, the supplier takes 25 days, and the reorder point is 150 including 50 of safety stock. Suppose the shelf holds 150 but the record says 190, an overstatement of 40.
With a correct record, the order goes out today and the delivery lands with 150 − (4 × 25) = 50 mugs still on the shelf. With the 190 record, the order waits until the record falls to 150. At 4 a day that is 40 ÷ 4 = 10 days away, by when the shelf is down to 110. The delivery then lands with 110 − 100 = 10 mugs left. The 50-mug buffer, which the safety stock guide sizes for a busy week or a late truck, has lost 40 units to a counting error nobody knew about.
The reverse costs too. A record that is too low orders early and ties up cash, and a record of zero for a product on the shelf can hide stock you could sell. On plans that include forecasting, Channel Bay shows days of stock left, worked out from stock and recent sales, so an overstated record makes a product look safer than it is. Accuracy counts every miss, over or under. For the money a count says you lost, see inventory shrinkage, which nets the lines and values the shortfall at cost.
Research on sales points in the same direction, with limits. A preprint first posted in 2025 (its arXiv listing does not say whether it has been peer reviewed) studied about 24,000 SKUs in 11 stores of one grocery retailer and reported that an inventory audit led to an 11% store-wide sales lift, concentrated on items whose system quantity was higher than what was physically there (Rekik, Oliva, Glock and Syntetos, arXiv, 2025). It covers groceries, including perishables, not online stores, so read it as a direction, not a forecast for yours.
How to Improve Inventory Accuracy
Records drift when stock moves and the record does not. These are the usual places, based on how stock moves through a business. We found no study that splits record errors by cause for online stores.
- Receive every delivery against its purchase order. Count what arrived and receive it the same day, so the record changes with the shelf. See goods receipt and how to receive inventory in Shopify.
- Post returns the day they happen. A box that leaves for a supplier, or a customer return back on the shelf, both change the count. See return to vendor.
- Close transfers at both ends. Stock in transit belongs to neither location until it lands. See Shopify inventory transfers.
- Clean up SKUs and barcodes. One SKU and one barcode per variant, no duplicates, and scan instead of typing.
- Keep channels in sync. A sale on Amazon that does not reach your records is a miss waiting to be counted. See keeping Shopify and Amazon inventory in sync.
- Give every adjustment a cause. Post a manual adjustment only with a reason, and limit who can post them where your tools allow it.
- Count where it misses. Count an item that missed twice more often, and cycle count the rest on a schedule. See cycle counting.
- Fix the cause, not the number. For each miss, check the movements since the last count: deliveries, returns, transfers, refunds and picks. The inventory reconciliation guide lists the causes in the order to check them.
Measuring Inventory Accuracy in Shopify, on Amazon and in Channel Bay
In Shopify
Shopify's stock counts record the counted and expected quantity for each variant, a manager approves the result before the difference is applied, and each change is logged in adjustment history (Shopify Help Center, stock counts). Work the percentage out from those counts in a spreadsheet. How to do a stocktake in Shopify walks through each counting tool.
On Amazon
Stock at Amazon fulfillment centers is not on your shelves, so you cannot count it yourself. Compare Amazon's inventory report with your records on the same schedule as your own counts, and treat a difference as a miss to trace.
In Channel Bay
In Channel Bay, a stocktake is a session for one location. Before you submit, the variance report shows expected, counted and variance for each line, with the value of the difference. It exports as CSV with the cost price and retail price beside each line, and you can add a note to any line, which is the place to log the cause. The count log records who counted what and when.
Channel Bay does not calculate an accuracy rate, so work it out from the exported report. With expected quantity in column B, counted in column C and unit cost in column D, for rows 2 to 11 (change the letters and rows to match your export):
| What | Formula |
|---|---|
| Within tolerance, per row (column E) | =IF(AND(ABS(C2-B2)<=ABS(B2)*0.05,ABS((C2-B2)*D2)<=50),1,0) |
| Within tolerance, by line | =SUM(E2:E11)/COUNTA(A2:A11) |
| Units | =1-SUMPRODUCT(ABS(C2:C11-B2:B11))/SUM(B2:B11) |
| Value | =1-SUMPRODUCT(ABS(C2:C11-B2:B11),D2:D11)/SUMPRODUCT(B2:B11,D2:D11) |
Keep one tab per count, and log each month's four results on a summary tab.
Common Inventory Accuracy Mistakes
| Mistake | What goes wrong | How to avoid it |
|---|---|---|
| Dividing total counted by total expected | Overstated and understated lines cancel, so a poor count scores near 100% | Compare line by line |
| Quoting a rate with no tolerance | The number cannot be compared month to month or with anyone else | Write the formula and tolerance beside it |
| Measuring on the first count | Counter mistakes are charged to your records | Measure on confirmed counts, and track first-count misses separately |
| Counting only fast sellers | The rate looks good while C items drift | Report by class and cover every active SKU in the year |
| Changing the formula mid-year | The trend means nothing | Pick one and keep it |
| Comparing with a benchmark from another measure | A 65% and a 95% may be different measures | Compare only like with like |
| Reading a trend from a handful of lines | One line moves the rate by 10 points on a 10-line count | Read by quarter, and treat about 100 lines as a rough minimum |
| Posting adjustments without a cause | The same miss comes back next count | Log the cause and change the process |
Frequently Asked Questions
What is inventory accuracy?
How do you calculate inventory accuracy?
What is a good inventory accuracy rate?
Why not divide total counted units by total expected units?
How often should you measure inventory accuracy?
How do you improve inventory accuracy?

Guides from the team that builds and supports Channel Bay, the Shopify inventory app for purchase orders, stocktakes, stock transfers and multichannel stock sync. About Channel Bay